
A Tableau associate has a data set that builds a union between two tables. The associate needs to extract the data set.
What should the associate use to extract the data set?
Physical tables that use a single table extract
Logical tables that use multiple table extracts
Logical tables that use a single table extract
Physical tables that use multiple table extracts
The correct configuration is Logical tables that use a single table extract, making C correct. In Tableau's data model, a union operates in the physical layer. The two unioned physical tables are merged into one resulting logical table. Tableau explicitly describes logical tables as containers that can contain multiple physical tables joined or unioned together. When an extract is stored using Logical Tables, Tableau creates one extract table for each logical table in the data source. Because the scenario contains one logical table composed of the two unioned physical tables, the extract is consequently represented as a single extract table. This is different from using Physical Tables storage. Physical storage retains an extract table for each physical table and is subject to additional eligibility restrictions. Tableau's current terminology replaced the older "Single Table" and "Multiple Tables" extract terminology with Logical Tables and Physical Tables, respectively. Official Tableau documentation states that physical tables joined or unioned inside a logical table are merged as part of that logical table, and that Logical Tables extract storage creates one extract table per logical table. Therefore, a two-table union forming one logical table corresponds to a logical/single-table extract structure.
Which string function returns a Boolean value as a result?
CHAR
FIND
UPPER
STARTSWITH
STARTSWITH is the function that returns a Boolean result, so D is correct. The function evaluates whether one string begins with a specified substring. Its conceptual syntax is STARTSWITH(string, substring). If the original string begins with that substring, Tableau evaluates the expression as TRUE; otherwise, it evaluates as FALSE. For example, STARTSWITH([Customer Name], "A") returns TRUE for values beginning with A and FALSE for other values. Because the output is Boolean, STARTSWITH is particularly useful in calculated fields, conditional expressions, filters, classifications, and data-quality logic. The other listed functions return different data types. CHAR converts a numeric character code to its corresponding character and therefore returns a string. FIND searches for the position of a substring and returns a numeric position. UPPER converts the supplied text to uppercase and returns another string. Consequently, only STARTSWITH directly produces the TRUE/FALSE result required by the question. This distinction is fundamental when selecting functions for Boolean calculations because Tableau evaluates Boolean fields differently from numeric and string-returning expressions.
Which two actions can a Tableau associate perform when joining tables from multiple connections?
Add a data source filter.
Use a stored procedure.
Create an extract.
Create a union.
A multi-connection data source created for a cross-database join can be filtered and can also be converted to or used with an extract, making A and C correct. Cross-database joins allow Tableau to combine tables originating from different supported connections into one logical data source. Tableau supports these joins with either live connections or in-memory extracts. Consequently, the associate can create an extract of the resulting multi-connection data source. Data source filters can also be used to reduce the records Tableau brings into the analytical environment, subject to connector-specific limitations. The other two choices conflict with documented multi-connection restrictions. Tableau explicitly states that stored procedures are not available for multi-connection data sources, eliminating B. A union appends rows from structurally similar tables. In a multi-connection environment, Tableau Desktop requires tables being unioned to come from the same connection; tables from different databases cannot be unioned directly in Tableau Desktop. Therefore, D does not meet the scenario involving tables across multiple connections. Tableau's official cross-database documentation explains that a cross-database join requires a multi-connection data source, supports both live and extract-based operation, prohibits stored procedures for such sources, and limits unions to tables within the same connection.
What are two outcomes when a Tableau associate drags a continuous date value to the Rows shelf?
The date part is displayed as labels.
The pill on the Rows shelf is green.
A quantitative axis is shown.
The pill on the Rows shelf is blue.
A continuous date field produces a green pill and generates an axis, making B and C correct. Tableau uses color as an immediate visual cue for discrete versus continuous fields. Green pills represent continuous fields, whereas blue pills represent discrete fields. A date can function in either form. When the analyst chooses a continuous date value such as continuous Month or continuous Year, Tableau represents the field as an unbroken temporal range rather than a finite collection of date-part headers. When this continuous date is placed on the Rows shelf, Tableau generates a continuous axis corresponding to the selected temporal granularity. The axis behaves similarly to other continuous quantitative axes in the sense that values occupy positions along an uninterrupted scale. Option A instead characterizes a discrete date part, such as discrete Month, where Tableau creates categorical headers or labels like January, February, and March. Option D is likewise associated with discrete fields because discrete pills are blue. Tableau's official Continuous Dates documentation states that continuous dates create an axis and that converting a date field to continuous causes the field to turn green. Tableau's general field-role documentation separately confirms that continuous fields create axes while discrete fields create headers.
A Tableau associate has a bar chart that has a dimension on the Columns shelf and a measure on the Rows shelf.
How can the associate make a stacked bar chart?
Drag another measure to the left of the measure on the Rows shelf.
Drag another dimension to Size on the Marks card.
Drag another measure to Color on the Marks card.
Drag another dimension to Color on the Marks card.
To convert the existing bar chart into a stacked bar chart, the associate should drag another dimension to Color on the Marks card. The initial bar chart already contains a dimension on Columns and a measure on Rows. Adding another categorical dimension to Color partitions each bar according to the members of that second dimension. Tableau assigns a separate color to each resulting group and, because automatic stacking is enabled for bar marks by default, those groups are displayed cumulatively within each bar. For example, if Category is on Columns and SUM(Sales) is on Rows, adding Segment to Color divides each Category bar into Consumer, Corporate, and Home Office segments while preserving the bar's total Sales magnitude. Dragging another dimension to Size changes the visual size encoding rather than creating standard stacked segments. Adding another measure to Rows typically introduces an additional axis or measure structure. A measure placed on Color generally creates a quantitative gradient rather than categorical stacked segments. Tableau's official Stack Marks documentation describes this exact construction: a dimension on Columns, a measure on Rows, and another dimension used to color-encode the marks.
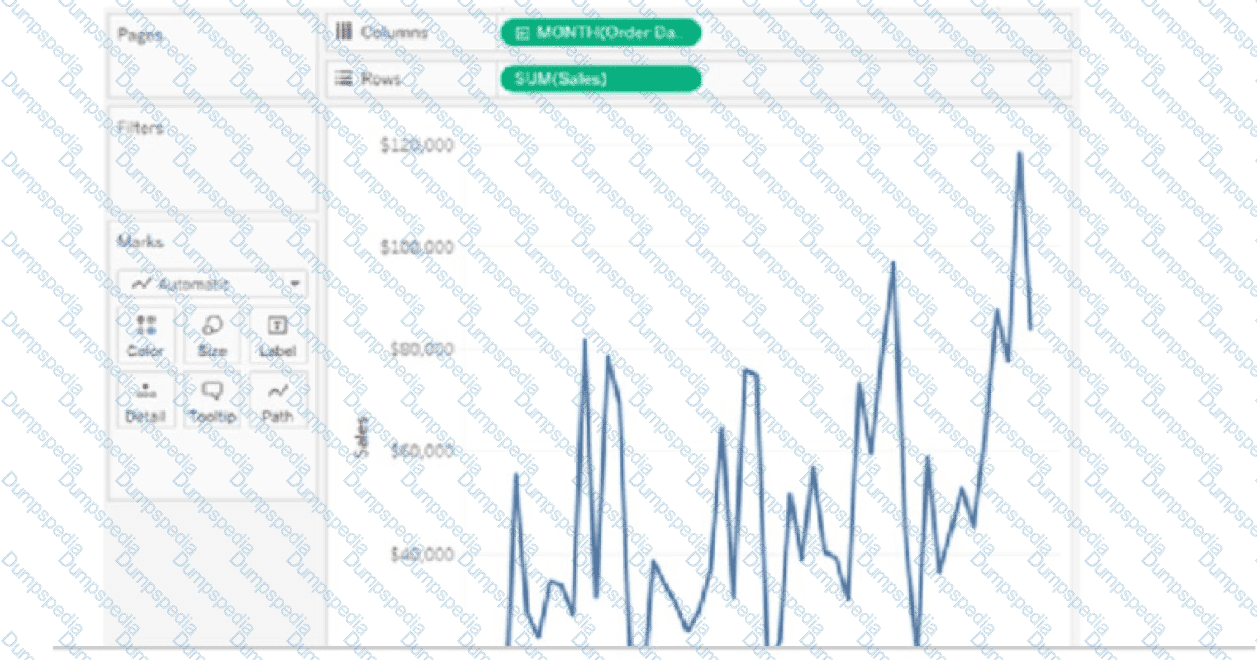
A Tableau associate has the following visualization.
Where should the associate place a field named Region to show multiple distinct lines on the same axis?
Color on the Marks card
The Rows shelf
Path on the Marks card
The Columns shelf
The associate should place Region on Color on the Marks card. A discrete dimension placed on Color partitions the marks according to the dimension's members. Consequently, the visualization produces a separate line for each Region while preserving the existing date field on Columns and Sales measure on Rows. For example, if Region contains Central, East, South, and West, Tableau separates the original Sales line into four distinct series and assigns a categorical color to each region. The lines remain plotted against the same continuous date and Sales axes, which satisfies the requirement for multiple distinct lines on the same axis. Placing Region on Rows or Columns would partition the visualization into separate panes or headers rather than overlaying distinct regional lines within the same plotting area. Path controls the order in which Tableau connects marks in a line or polygon and therefore does not provide the required categorical separation. Tableau's Marks card is specifically designed to encode fields by visual properties such as Color, Size, Label, Detail, Tooltip, and Path. Official Tableau documentation confirms that placing a discrete field—typically a dimension—on Color assigns a distinct categorical color to each value.
Which three elements are included in a packaged workbook (.twbx)?
Background images
Custom shapes
A PDF copy of the workbook
Tableau Datasource Customization (TDC) files
Extract files
A Tableau packaged workbook uses the .twbx format to bundle a workbook with supporting local resources needed to use it outside the author's original environment. The correct elements are background images, custom shapes, and extract files. Tableau explicitly lists background images, custom shapes, and Tableau extract files (.hyper) among the resources that can be incorporated into a packaged workbook. These supporting assets are bundled so that another user does not need access to the original local paths used by the workbook author. Other packageable resources include custom geocoding, local cube files, Excel files, Access files, and text-based local data sources. A PDF version of the workbook is not automatically generated and embedded inside a .twbx, making C incorrect. A Tableau Datasource Customization .tdc file is likewise not listed among the standard resources incorporated into a packaged workbook. A .twbx is therefore fundamentally a portable Tableau workbook package rather than simply a workbook definition. This distinction is important when distributing workbooks that depend on local resources. Official Tableau Desktop documentation lists background images, custom shapes, and Tableau extract files among the files included in packaged workbooks.
A Tableau associate needs to display the complete list of potential data connections when connecting to a server.
Which action should the associate perform?

Select Connecting to Data.
Select File on the menu, and then select New.
Select More under To a File.
Select More under To a Server.
The associate should select More under To a Server, making D correct. Tableau Desktop organizes available connectors on the Connect pane into broad categories such as To a File and To a Server. Frequently used server connectors may be displayed directly, but Tableau provides the More option to expose the complete list of supported server-based connection types available in the installation. Official Tableau connector documentation repeatedly states: For a complete list of data connections, select More under To a Server. This workflow is used when locating database and server connectors such as Microsoft SQL Server, PostgreSQL, SharePoint Lists, and other supported platforms. Selecting More under To a File instead displays file-based connection types and therefore does not satisfy a requirement specifically involving server connections. Choosing File > New creates a new workbook and does not expose the complete server connector list. "Connecting to Data" is not the command required to reveal all server options. This distinction is operationally important because the Connect pane intentionally surfaces common connector choices while More exposes the broader connector catalog. Current Tableau documentation for multiple server connectors confirms the More under To a Server workflow for viewing the complete connection list.
Which two statements accurately describe relationships in Tableau Desktop?
Maintains each table's level of detail (LOD) without duplicating records
Maintains tables separately in the data source
Used to join physical tables into a single logical table
Used to establish an explicit join type
Relationships are designed to preserve each table's level of detail and keep logical tables separate within the data source, making A and B correct. Unlike physical joins, relationships do not flatten participating tables into one combined row-level table when the data source is created. Tableau keeps each logical table distinct and evaluates the relationship dynamically based on fields actually used in a visualization. This architecture helps Tableau analyze data residing at different granularities while reducing the duplication and data-loss risks that can occur with fixed physical joins. Tableau's official relationship documentation explicitly states that relationships maintain each table's native level of detail and create independent domains at multiple granularities. The tables are not merged together in the data source. Option C describes the behavior of joins or unions in the physical layer. Physical tables can be combined to form one logical table, but this is not what a relationship does. Option D is also incorrect because relationships do not require the author to choose a fixed join type such as inner, left, right, or full outer. Tableau determines appropriate joins contextually during analysis. Relevant Tableau Desktop concepts include logical tables, physical tables, relationships, contextual joins, cardinality, and preservation of granularity.
TESTED 12 Oct 2026