dumpspedia logo

A Data Analyst is building a dashboard and wants to allow users to select which measure is being shown on one of the charts.
Which type of action should the analyst use to accomplish this?
You have the following dataset.
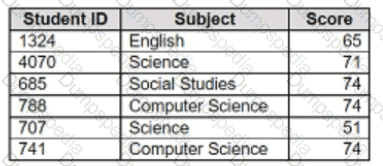
You want to create a new calculated dimension field named Category that meets the following conditions:
. When Subject is Computer Science or Science, Category must be Sciences.
. When Subject is English or Social Studies, Category must be Humanities.
Which two logical functions achieve the goal? Choose two.
A Data Analyst creates a parameter named Choose Region that contains values from a field named Region.
The analyst wants users to be able to use the Choose Region parameter to interact with a chart by toggling between different regions.
What should the analyst do next?
A Data Analyst creates a worksheet named Sales by Region and hides the title of the worksheet.
The analyst prints the worksheet as a PDF file and notices that the worksheet title appears.
The analyst needs to prevent the title from appearing when printing the worksheet as a PDF.
Which setting should the analyst configure from the File menu in Tableau Desktop?
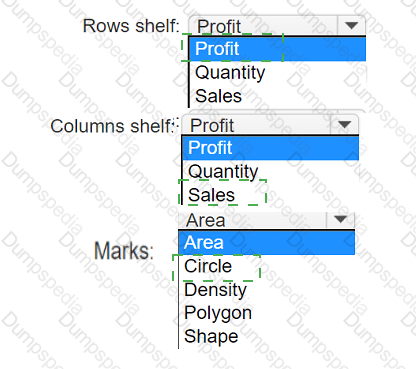
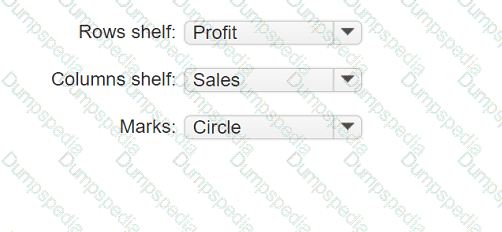
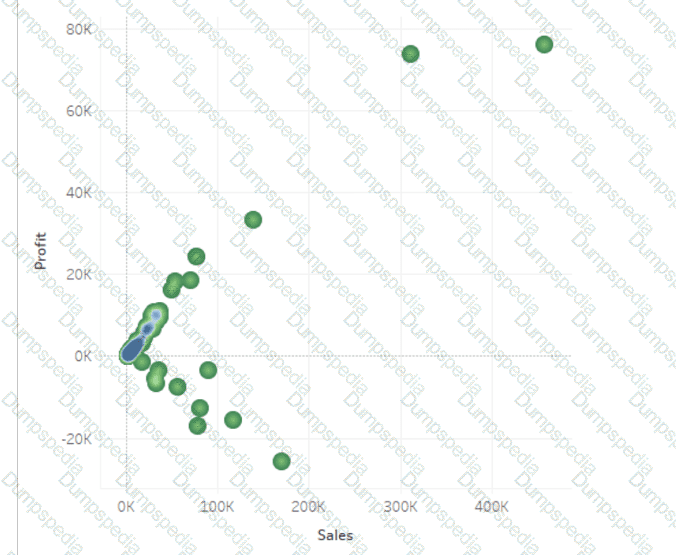
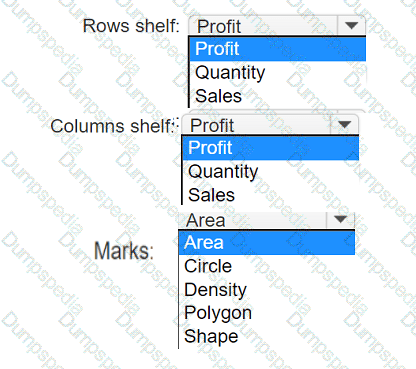
You have a data set that contains three columns named Sales, Profit, and Quantity.
You need to build the following scatter plot.
You have the following:
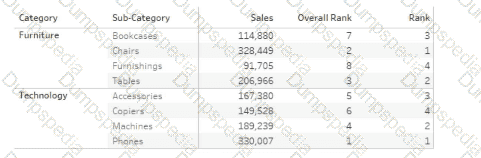
Overall Rank and Rank are calculated fields that use the RANK function.
You filter out the sub-category where [Ovorall Rank] - 1.
For which three the sub-categories will the value of Rank change? Choose three.
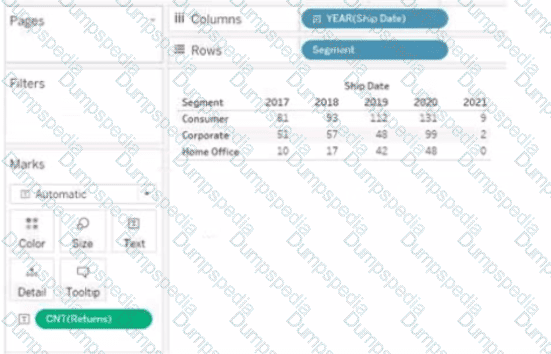
You have the following visualization.
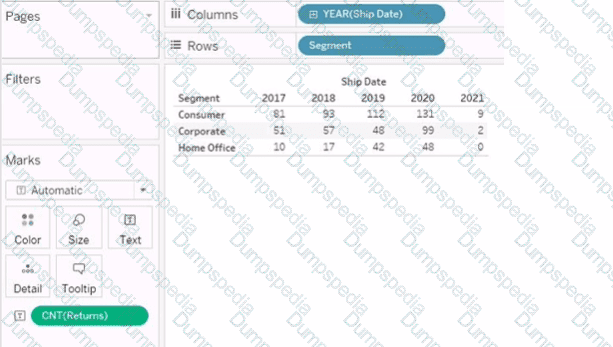
You want the count of Returns displayed only for the first year in the table.
How should you complete the formula in the calculated field? (Use the dropdowns in the Answer Area to select the correct options to complete the formula.)

Which function should a Data Analyst use to average sales at a less-granular level of detail than is in the view?
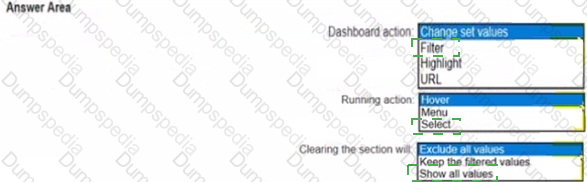
You have the following dashboard.
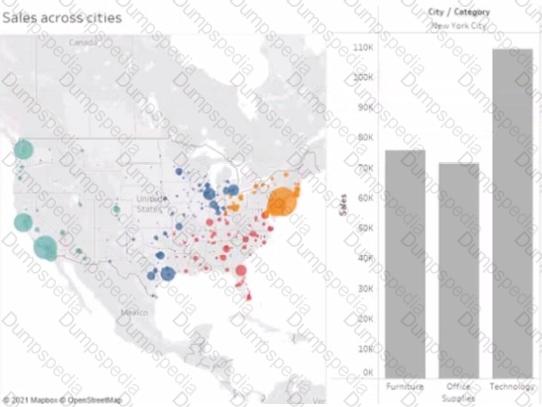
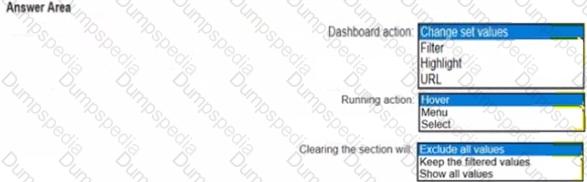
When a user selects a only on the map the data on the bar chart must show only the data for the selected city. The data in the bar chart must change only when the user selects a different city How should you configure the dashboard action? (Use the dropdowns in the Answers Area to select the correct options.)
A Data Analyst has the following dataset.
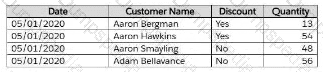
The analyst wants to create a parameter to dynamically filter the data to produce the following results based on quantity being above X value.

Which two types of parameters should the analyst use to produce the results? (Choose two)
A Data Analyst has the following worksheet, with Profit data for Categary and Sub-Categury.
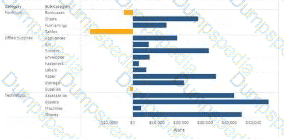
The analyst executed the following calculated field at the Total level:
COUNTD( IF ( INCLUDE [Sub-Category]: SUM([Profit] ) < 0 THEN [Category] END )
What is the result?
A Data Analyst looks into the item hierarchy in a dashboard.
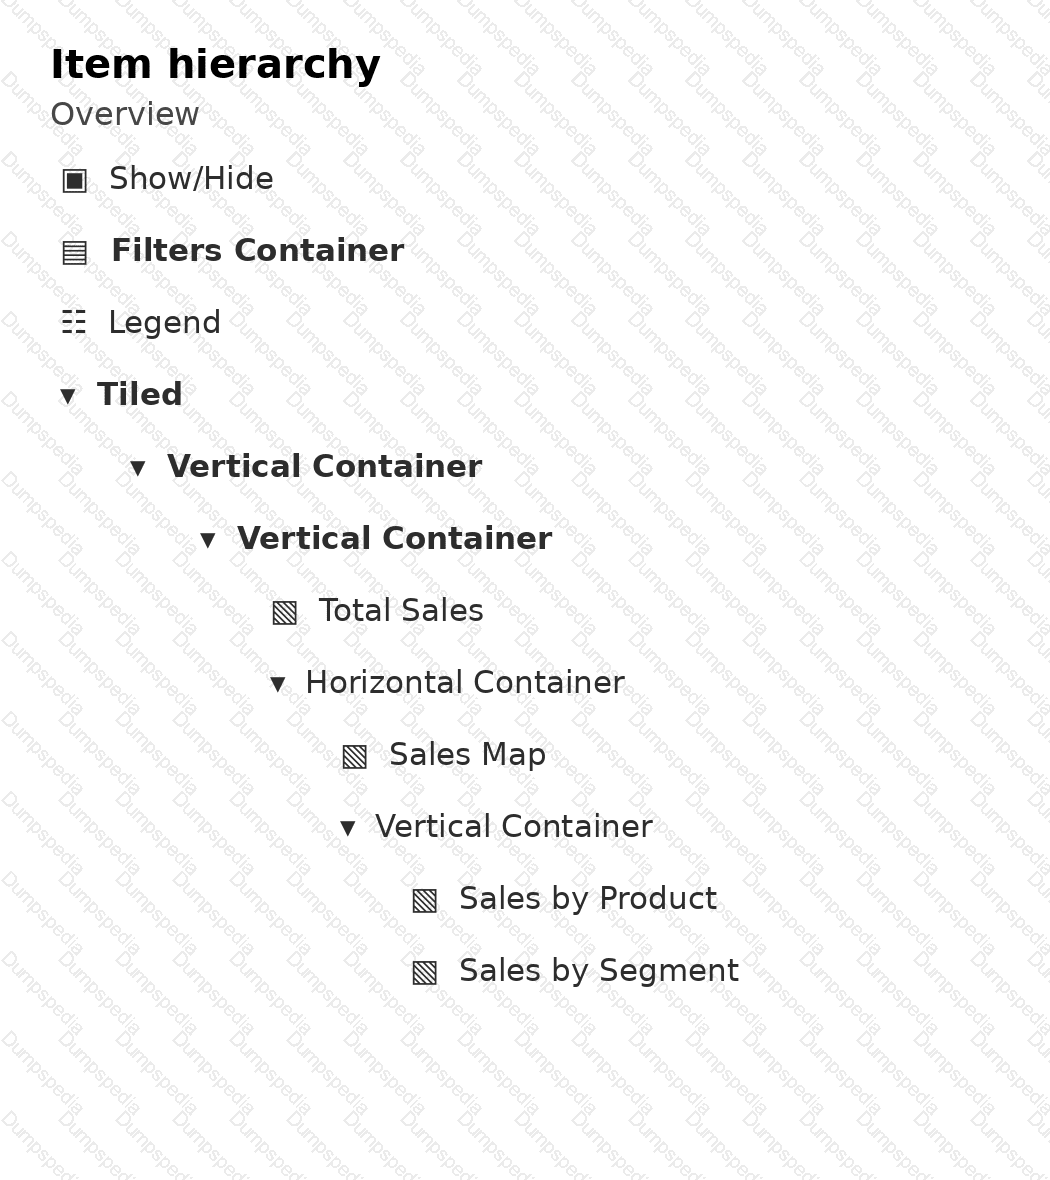
Which three elements are floating? Choose three.
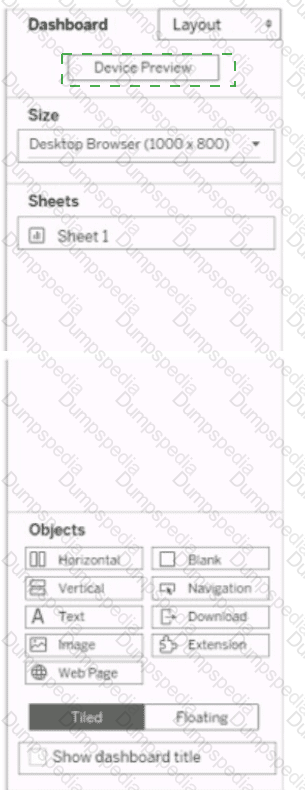
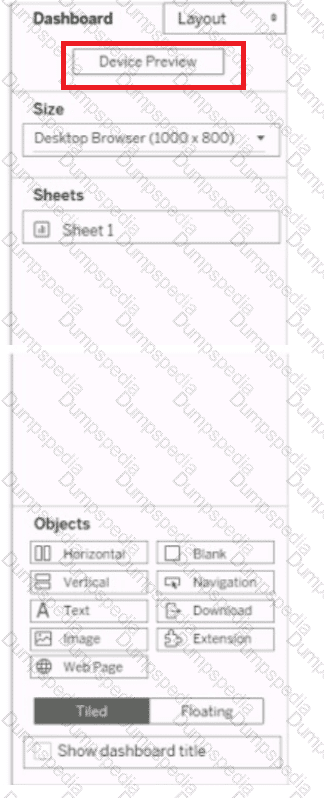
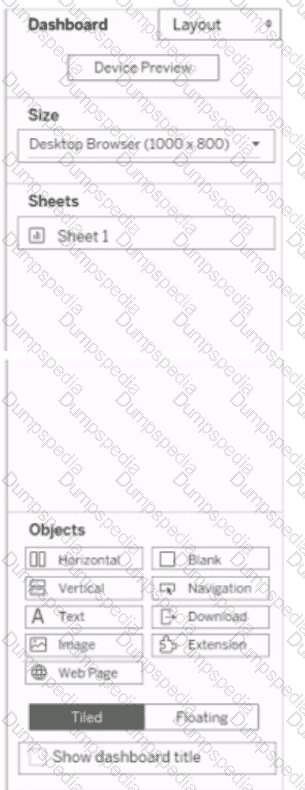
You have a dashboard that is configured for desktop browsers.
You want to customize a layout for mobile users.
Which option should you select first? (Click the appropriate Option in the Answer Area.)
You have the following line chart that shows the average sales by month.
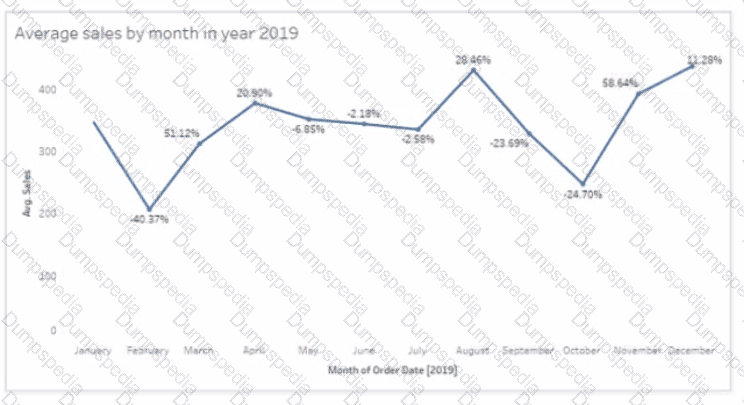
Which month had the biggest increase in swage sales compared to me previous month in 2019?
You have the following dashboard that contains two sheets.
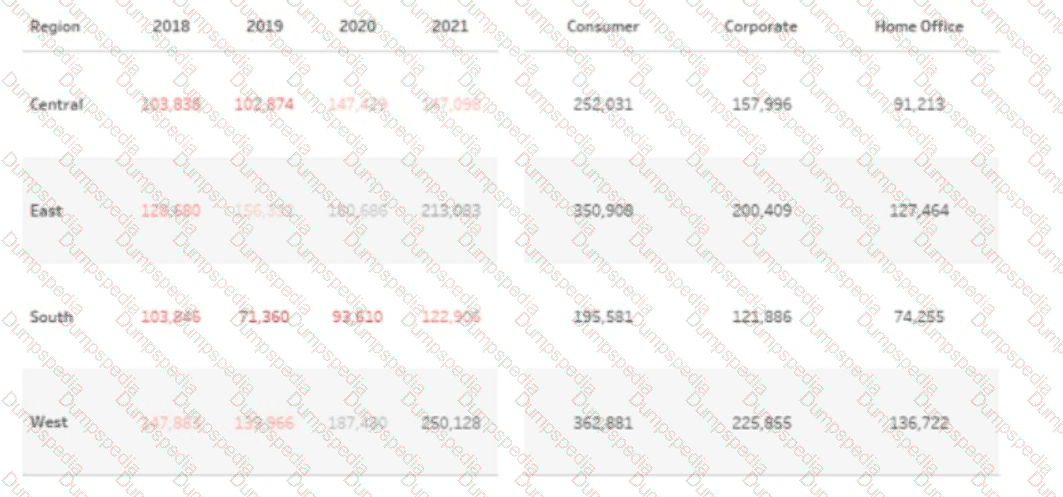
You want to minimize the whitespace between the sheets.
What should you configure?
A Data Analyst has the following primary data source that contairis a dimension named Dorm_Code.
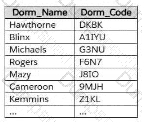
The analyst receives the following secondary data source that contains updated dorm codes.
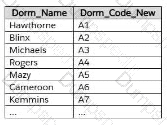
The analyst needs to bring the updated dorm codes into Tableau and use the codes in existing visualizations. The new dorm codes must use the existing field name of Dorm_Code.
What should the analyst do?
A Data Analyst decides to add custom shapes to some key performance indicators (KPIs) in order to indicate their performance.
How should the analyst make the custom shapes available in a workbook?
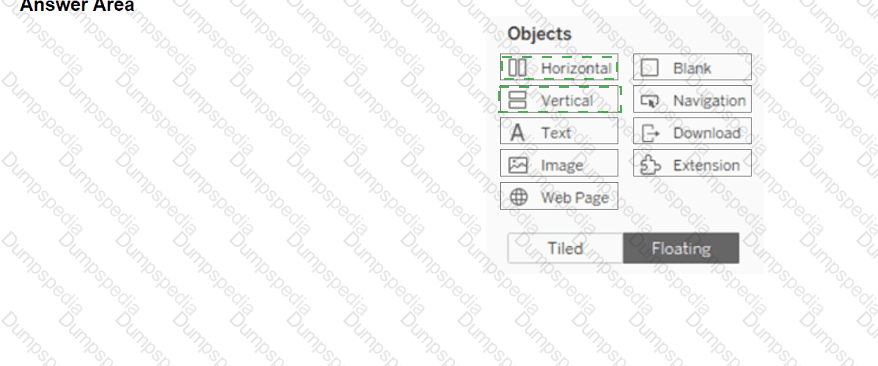
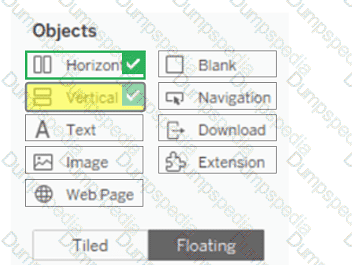
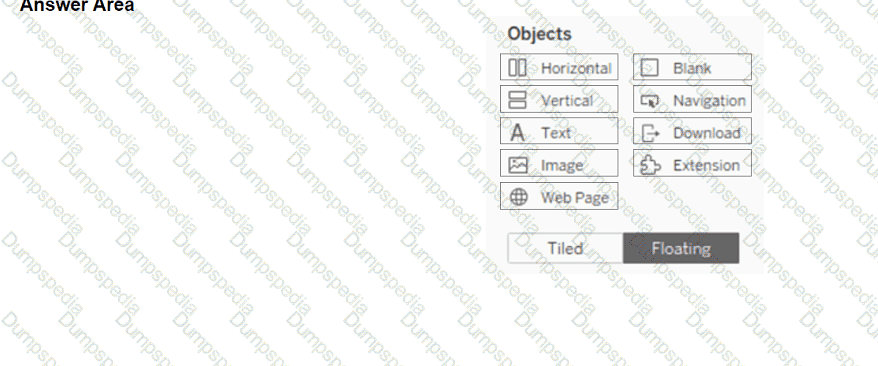
You have a blank dashboard.
You want to add two sheets to the dashboard. The sheets must support the Show/Hide button.
To which two objects can you add the sheets? (Click the two appropriate Options in the Answer Area.)
You have a dataset that contains people and the awards they have won.
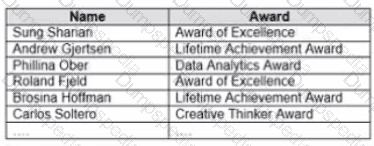
Which formula should you use to get the number of different types of awards that have been won?
You have a data source that contains the following columns.
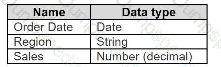
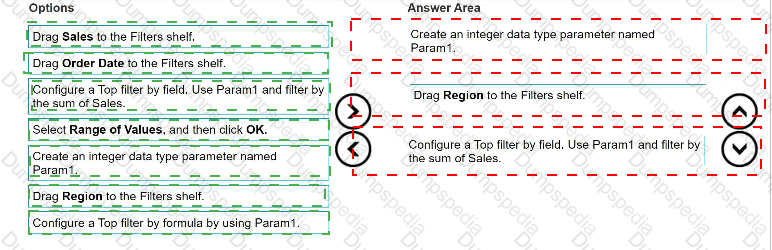
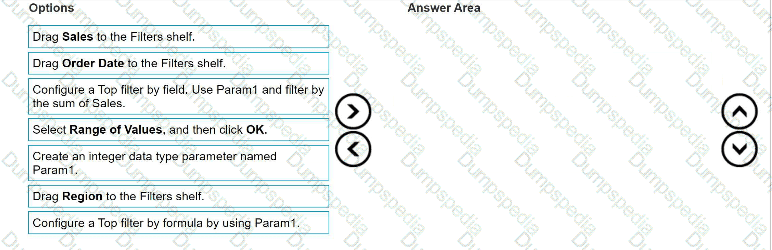
You want to filter regions based on the highest sales. Users must be able to specify the number of regions shown.
Which three actions should you perform in order? (Place the three correct options in order. Use the arrows to move Options to Answer Area.
Use Answer Area arrows to re-order the options.)
You have the following map.
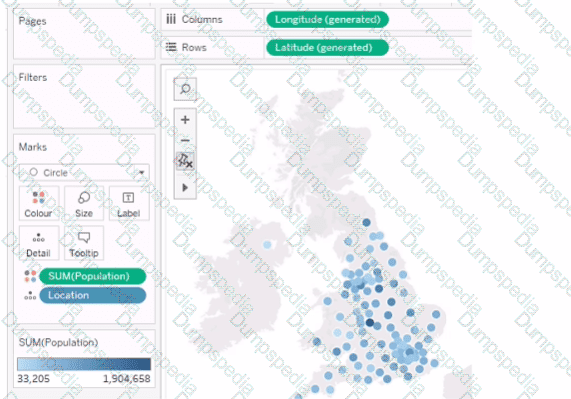
You need the map to appear as shown in the following visualization.
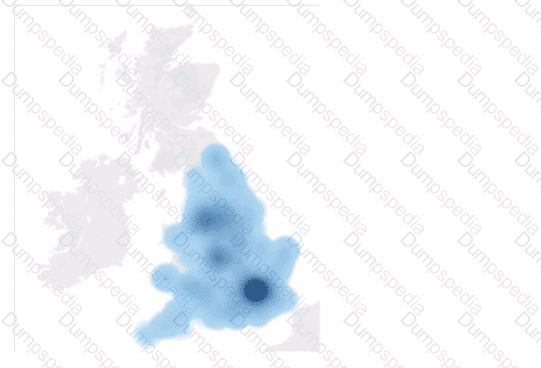
What should you do?
Which type of visualization interaction can a Data Analyst achieve using set actions?
You publish a dashboard that uses an extract. The extract refreshes every Monday at 10:00.
You need to ensure that the extract also refreshes on the last day of the month at 18:00.
What should you do?
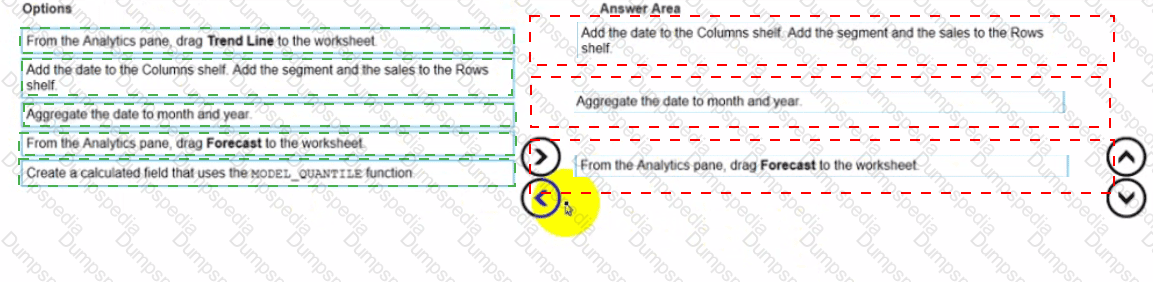
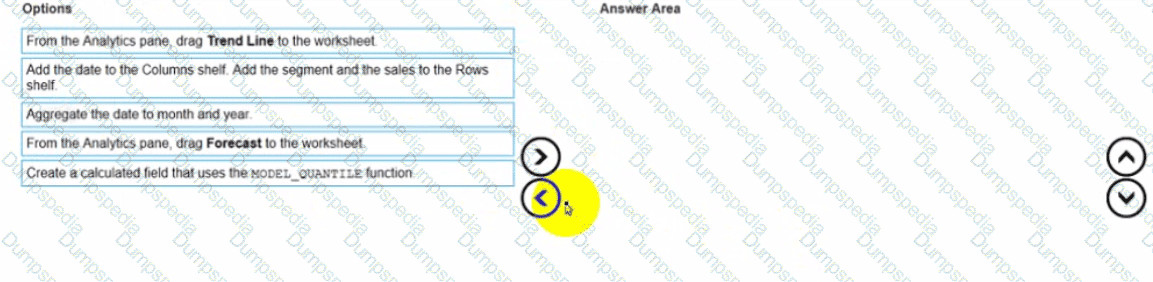
You have a dataset that contains daily sales by business segment from 2017 to the present
You want to use monthly historical trends to predict sales by segment in the future
Which three actions should you perform m order?
(Place the three correct options in order Use the arrows to move Options lo Answer Area I In Answer Area arrows to re order the options.)
You have the following dataset.
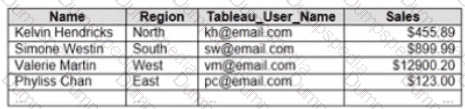
You plan to create a dashboard that will be filtered to show only data that is relevant to a specific Tableau user based on the Tableau_User_Name field You need to create a boolean calculated field to place on the data source finer Which formula should you use for the filter?
You have the following chart that shows the cumulative of sales from various dates.
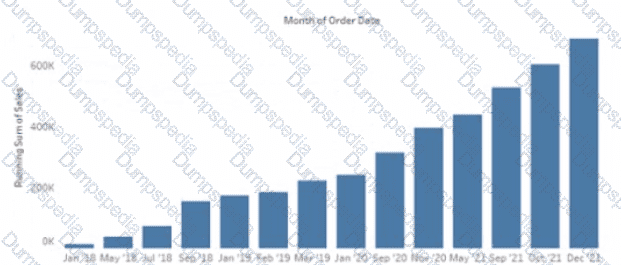
You want the months to appear as shown in the following chart.
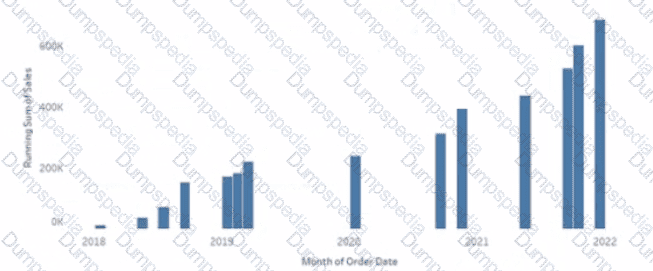
What should you do?
In a dataset, a Data Analyst has a string field named Name that contains unnecessary semicolons.
Which function should the analyst use to remove the semicolons from the Name field?
You create the following worksheet
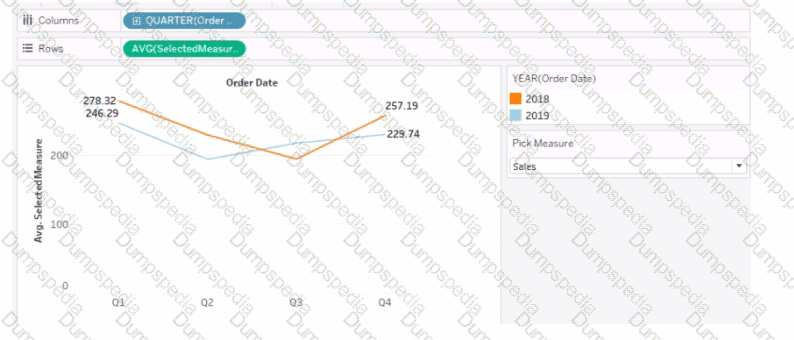
The Pick Measure parameter contains the following list of values
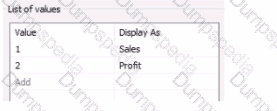
Users can select a value from Pick Measure to change the visualization to show either the Sales measure or the Profit measure.
Which formula is used in the Selected Measure calculated field lo switch between measures?
A Data Analyst is creating a map that includes multiple data layers at country, state, and city levels. Users want to customize their map by turning layers on and off as needed.
How should the analyst provide this functionality?
You have the following primary data source that contains a dimension named Dorm_Code.
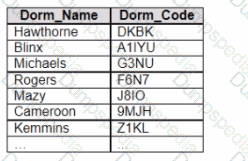
You receive the following secondary data source that contains updated dorm codes.
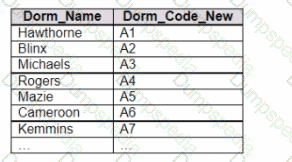
You need to bring the updated dorm codes into Tableau and use the codes in existing visualizations. The new dorm codes must use the existing field name of Dorm_Code.
What should you do?
A Data Analyst configures the When Workbook Opens option in the allowable values section when creating a parameter.
What is a user of a workbook able to do?
You have the following Map.
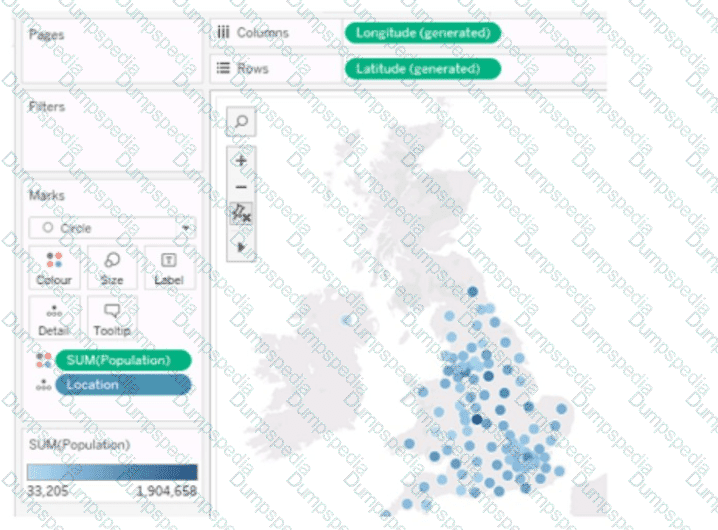
You need the map to appear as shown in the following visualization.
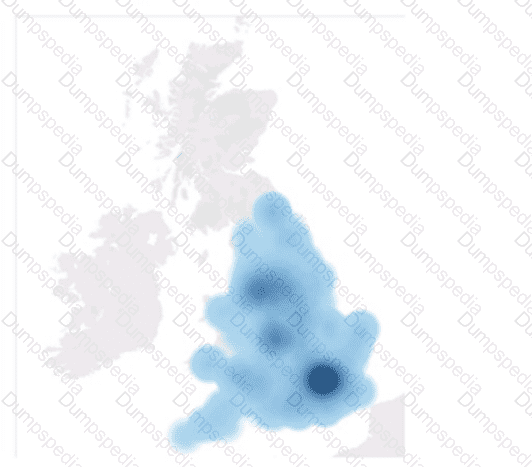
What should you do?
A Data Analyst needs to analyze the financial performance of the sales team. In order to make the dashboards easier to understand, the analyst needs to format the financial values to show the dollar symbol ($) in front of the value.
How should the analyst enable this formatting across the workbook?
A Data Analyst has a data source that contains data for every city in the United States. The following is a sample of the data.
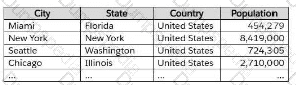
The analyst needs to use the City dimension to create a dynamic filter that shows the cities that have a population greater than 1 million.
Which type of filter should the analyst use?
A Data Analyst has the following dataset.
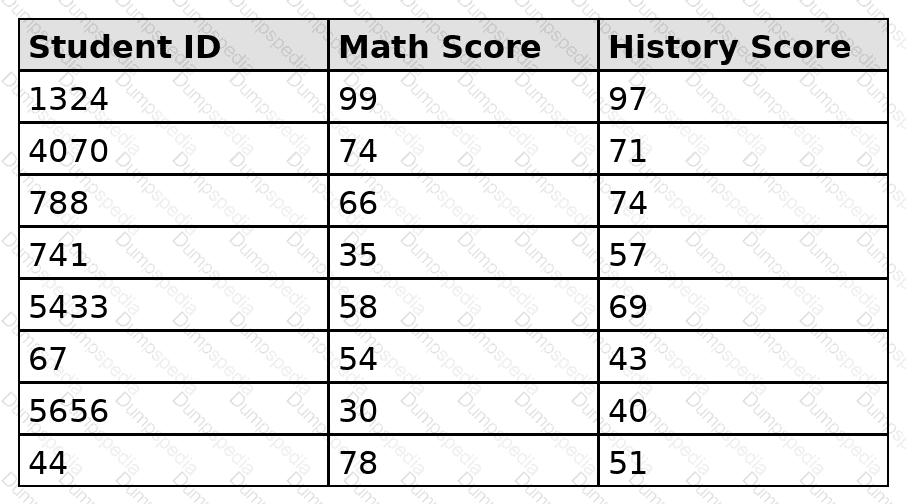
The analyst needs to analyze the relationship between math scores and history scores as shown in the following exhibit.
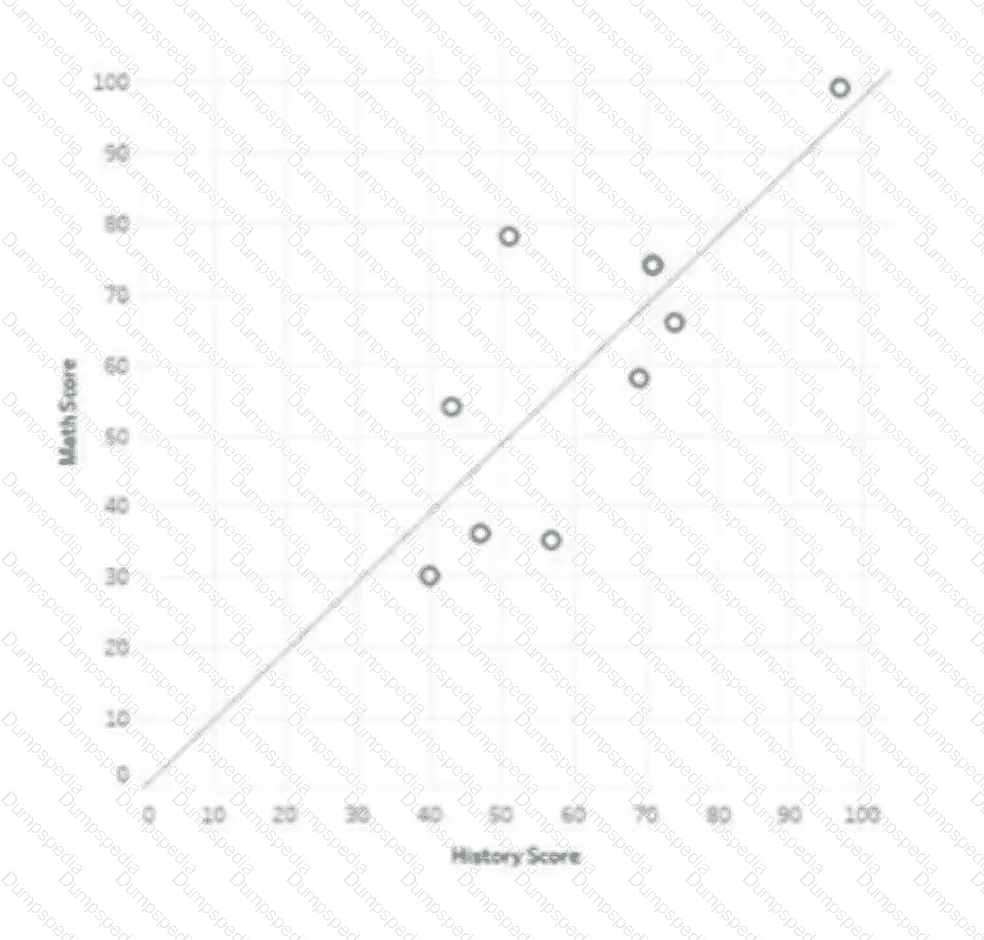
Which three actions should the analyst perform? Choose three.
You have a database that includes field named sales, City and Region.
You have the following chart that shows the number of sales made in different cities.
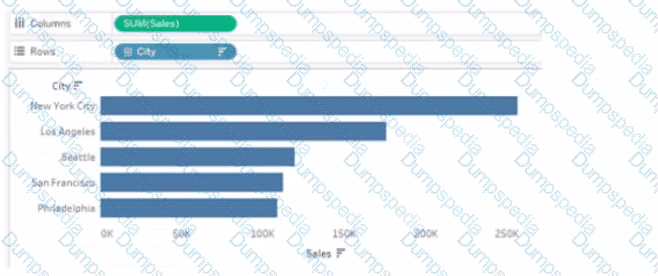
You want to dynamically show the corresponding region when users hover their mouse over any of the bars.
What should you do?
A Data Analyst has two tables named EmployeeInfo and DepartmentInfo. EmployeeInfo contains four fields named Full Name, Department ID, Start Date, and Salary. DepartmentInfo contains four fields named Department Name, Size, Department ID, and VP. The analyst wants to combine the tables to meet the following requirements:
EmployeeInfo is the first table that is dragged to the canvas,
The records must contain the Full Name, and the Department Name, Size, and VP fields if available,
Not all records have an exact match.
Which type of join should the analyst use?
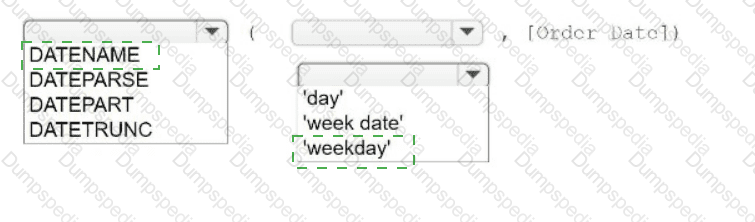
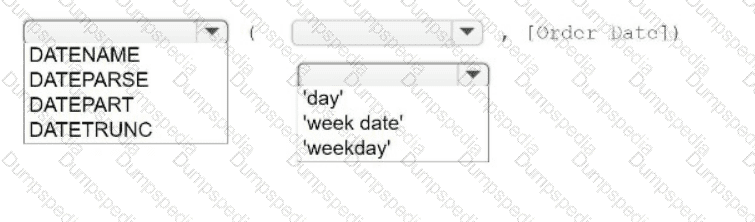
You have a table that contains four columns named Order Date, Country, Sales, and Profit.
You need to add a column that shows the day of the week for each row. For example, orders placed on August 31, 2022, will show a day of
Wednesday.
How should you complete the formula? (Use the dropdowns in the Answer Area to select the correct options to complete the formula.)
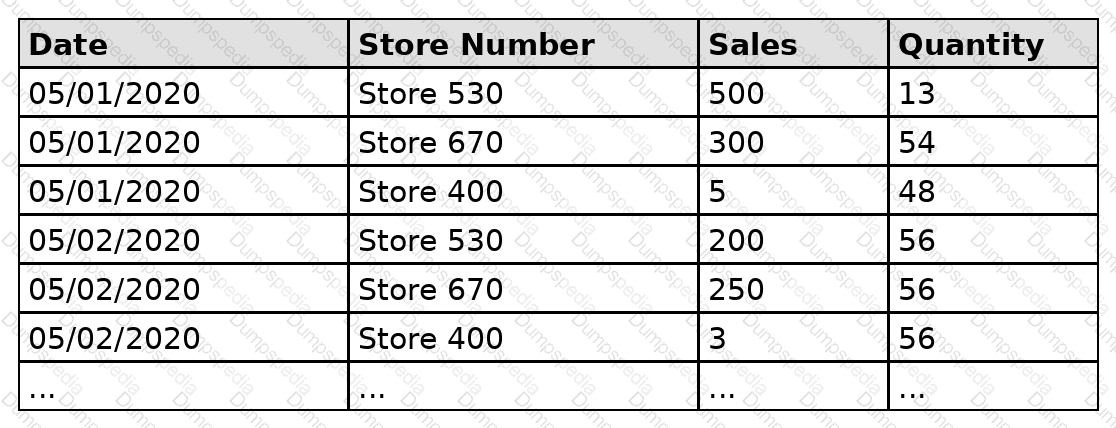
A Data Analyst has the following dataset that contains sales for the month of May.
The analyst plans to create a data extract from the dataset. The analyst wants to extract data only from stores that have $500 or more in total sales.
What should the analyst do?
You have a Tableau workbook.
You want to make the workbook available in Tableau Online.
What should you do?
You are creating a new dashboard.
You need to add a button to the dashboard that allows users to export the dashboard as an image.
Which type of object should you use?
A Data Analyst has the following view.
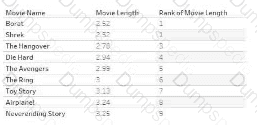
The analyst wants to filter the view to show only records that have a movie name starting with the word " The " . The analyst must achieve the goal without writing any formulas.
Which type of filter should the analyst use?
You subscribe to a view that delivers a daily email to your inbox.
You want to make the subscription available to other stakeholders.
What should you do?
You have the following bar chart.
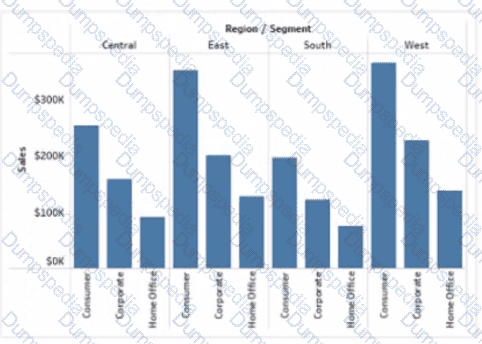
You want the chart to appear as shown in the Mowing exhibit.
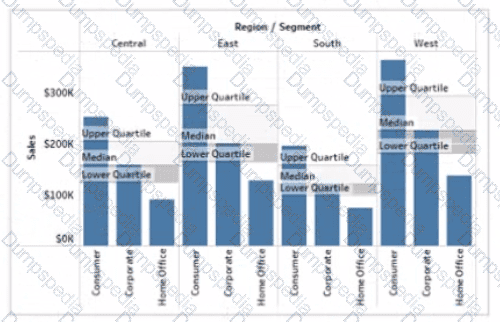
What should you add?
A Data Analyst has the following dataset that contains null values in the Profits field.
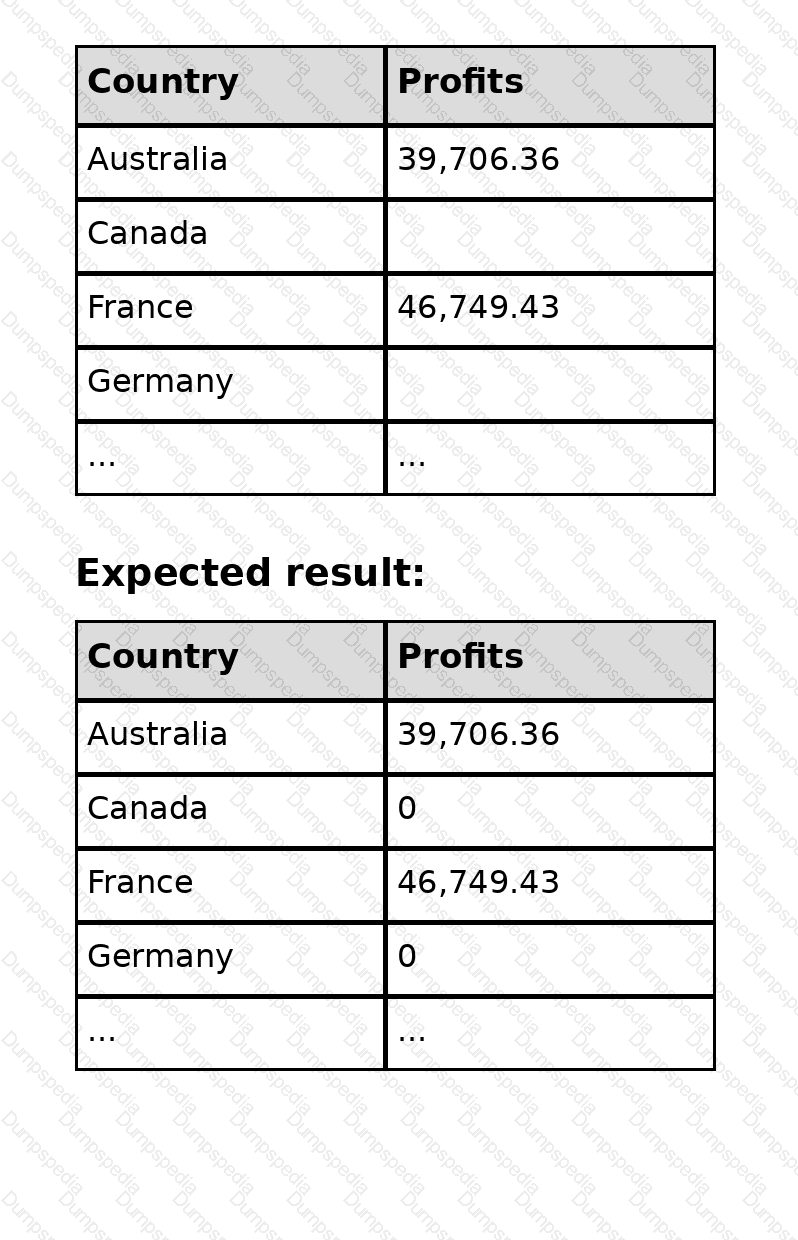
The analyst wants each null Profit value to appear as 0.
Which two formulas achieve this goal? Choose two.
You company has two divisions located in the United States and Germany Bach division has a separate database. The following is a sample of the sales data for the division in the United States.
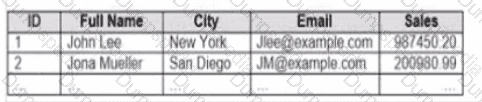
The following is a sample of the sales data for me division in Germany.
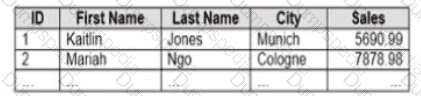
You have population data in a file named Populatio.csv. the following is a sample of the data.
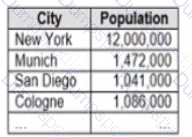
You plan to create a visualization that ml show tie sales per capita for each salesperson Each salesperson must be identified by identified by their full name.
You need to prepare the data to support the planned visualization. The data source must support being published .
Which four actions should you perform in order?
(Place the four correct options n order Use the arrows to move Options to Answer Area arrows to re-order the options.
Use Answer Area arrows to re-order the options)

A Data Analyst has the following tiled dashboard that has one sheet called Sheet 3.
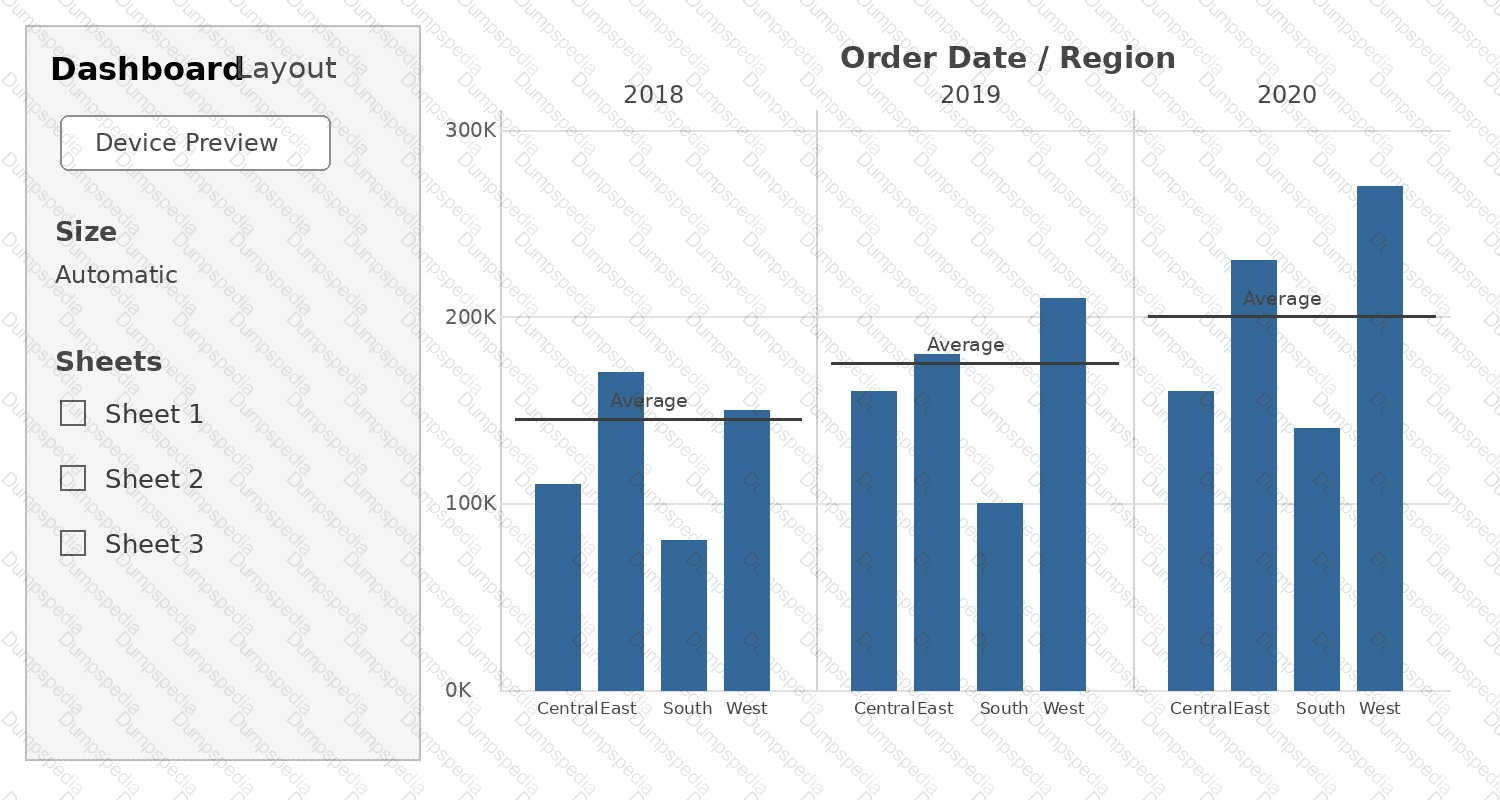
The analyst wants to replace the sheet with Sheet 2.
What should the analyst do?
You want to add a comment to March 2020 as shown in the following visualization.
You have the following sets in a Tableau workbook
• Top N Customers
• Customers of 2020
• Top N Products
• Sellers of 2020
Which two sets can you combine? Choose two
You have the following tiled dashboard that has one sheet.
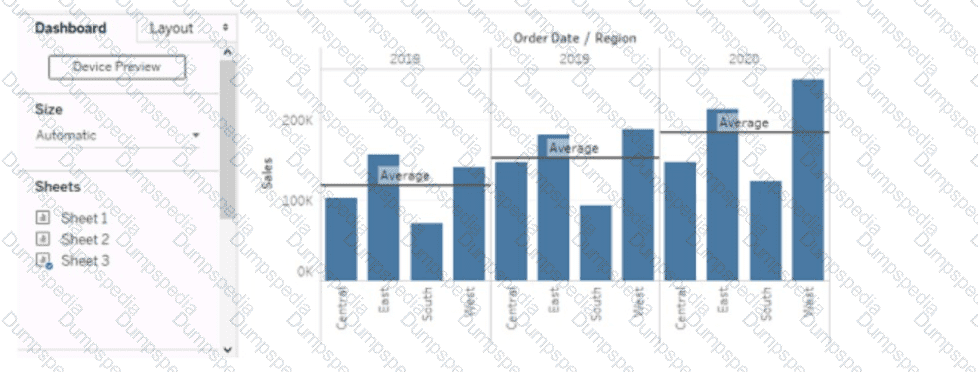
You want to replace the sheet with Sheet2.
What should you do?
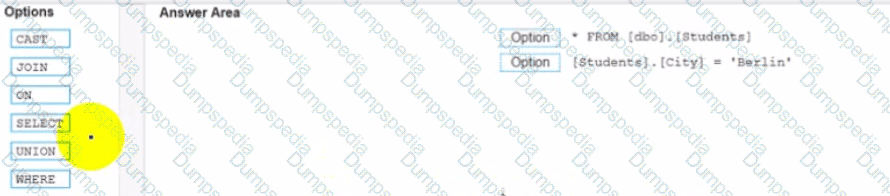
You conned to a Microsoft SQL Server database
You need to create a custom SQL query that retrieves rows from a table named Students Only students m the city of Berlin must be returned
How should you complete the query? (Drag the appropriate Options to the Answer Area and drop into the correct locations.)
A Data Analyst has a website that displays data in a table format.
The analyst wants to connect to the data of the website by using the least amount of effort.
What should the analyst use to connect to the data?
You create the following story that contains two story point.
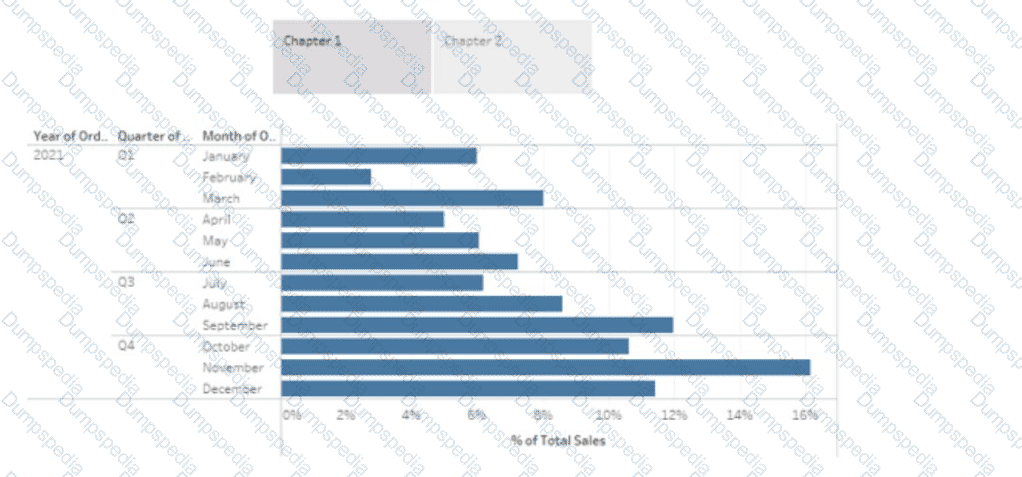
You want to change the story point format to show the current story point number out of the total number of story points.
Which Layout option should you use?
You have the following visualization.
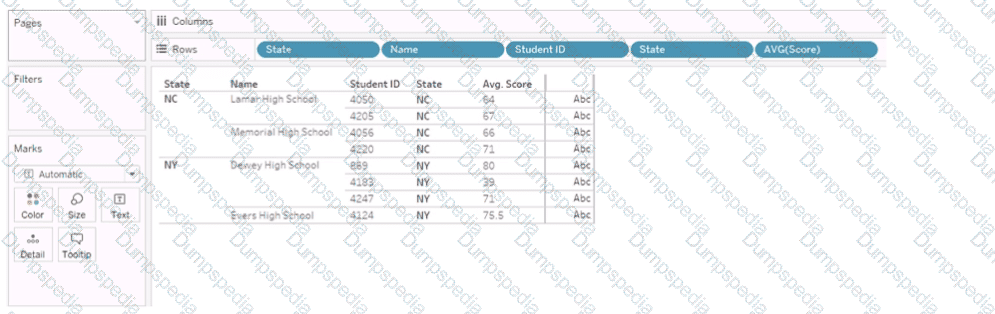
You Create a table calculation named Rank_Score that has a formula of RANK(AVG([Score]), and you drag Rank_Score to Text on the Marks cards.
What is the Rank Score value for Student ID 4220?
A Data Analyst needs to add a custom color palette to Tableau Desktop for use across multiple workbooks. The palette must reflect the company ' s branding.
What should the analyst do?
You have the following dataset that contain null values in the Profits field.
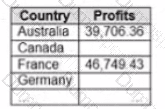
You want the data to appear as shown in the following table.
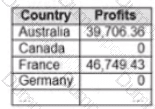
Which two formulas achieve the goal? Choose two.
You have the following chart that shows profits and discounts over time.
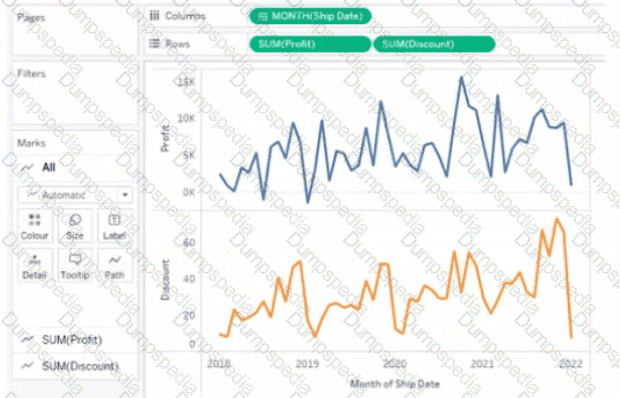
You need to combine the lines to appear as shown in the following chart.
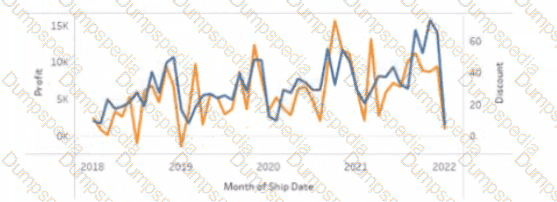
What should you do?
You want to create the following dashboard that will contain two sheets.
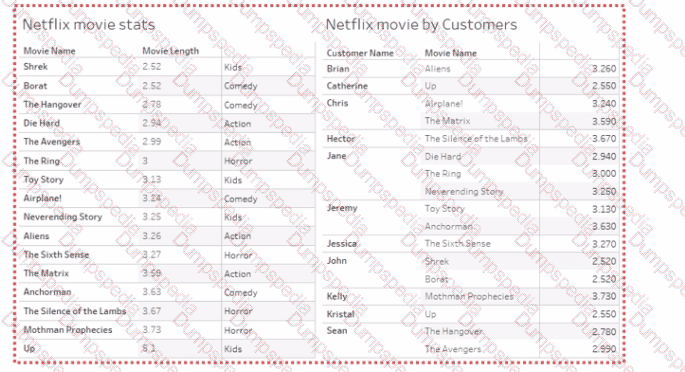
What should you do?

TESTED 12 Oct 2026