dumpspedia logo

The scatterplot shows data on the population of rabbits in a nature preserve. The graphed regression function has an r^2value of 0.94.
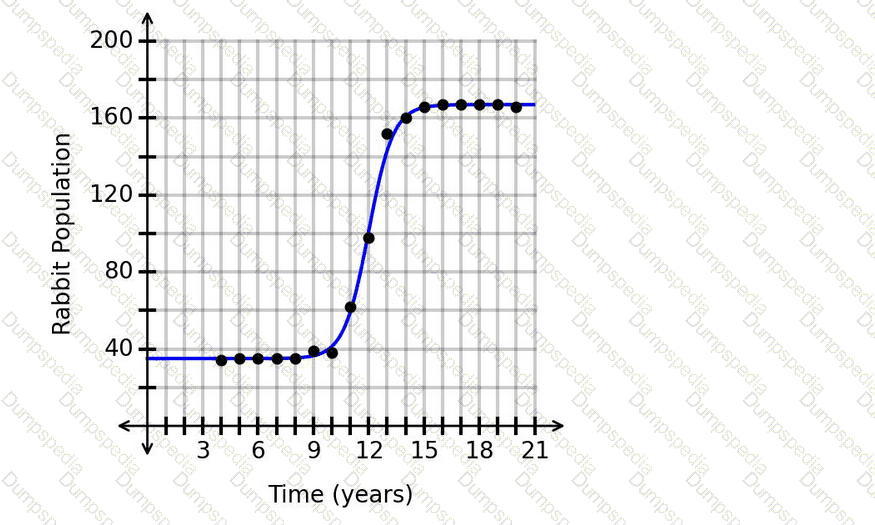
What is the appropriate range of x-values for extrapolation?
The scatterplot shows data on the number of visitors to a resort each week since opening. A regression function is graphed with r^2=0.99. The predicted number of visitors after 16.4weeks is 38.6.
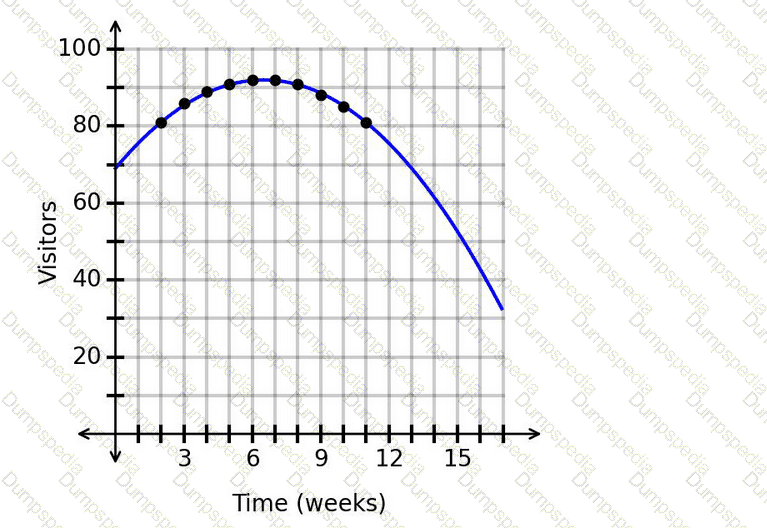
Is this prediction appropriate?
The graphed function v(t) represents the number of vehicles, v, stopped at a toll booth t hours after 6:00 a.m. The coordinates of points A and B are (1,49.4) and (4,45.8), respectively.
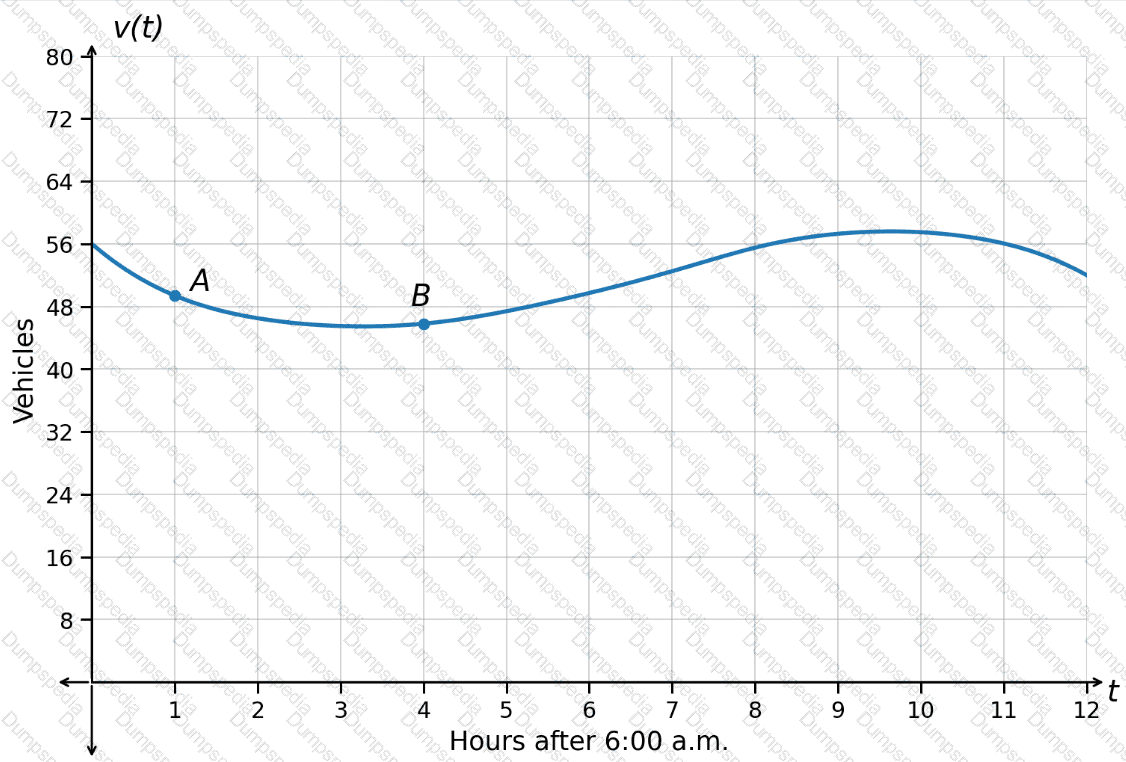
What is the average rate of change of the number of vehicles from point A to point B?
The number of new user accounts per day on a website is modeled by a decreasing exponential function. The graph of the function is shown.
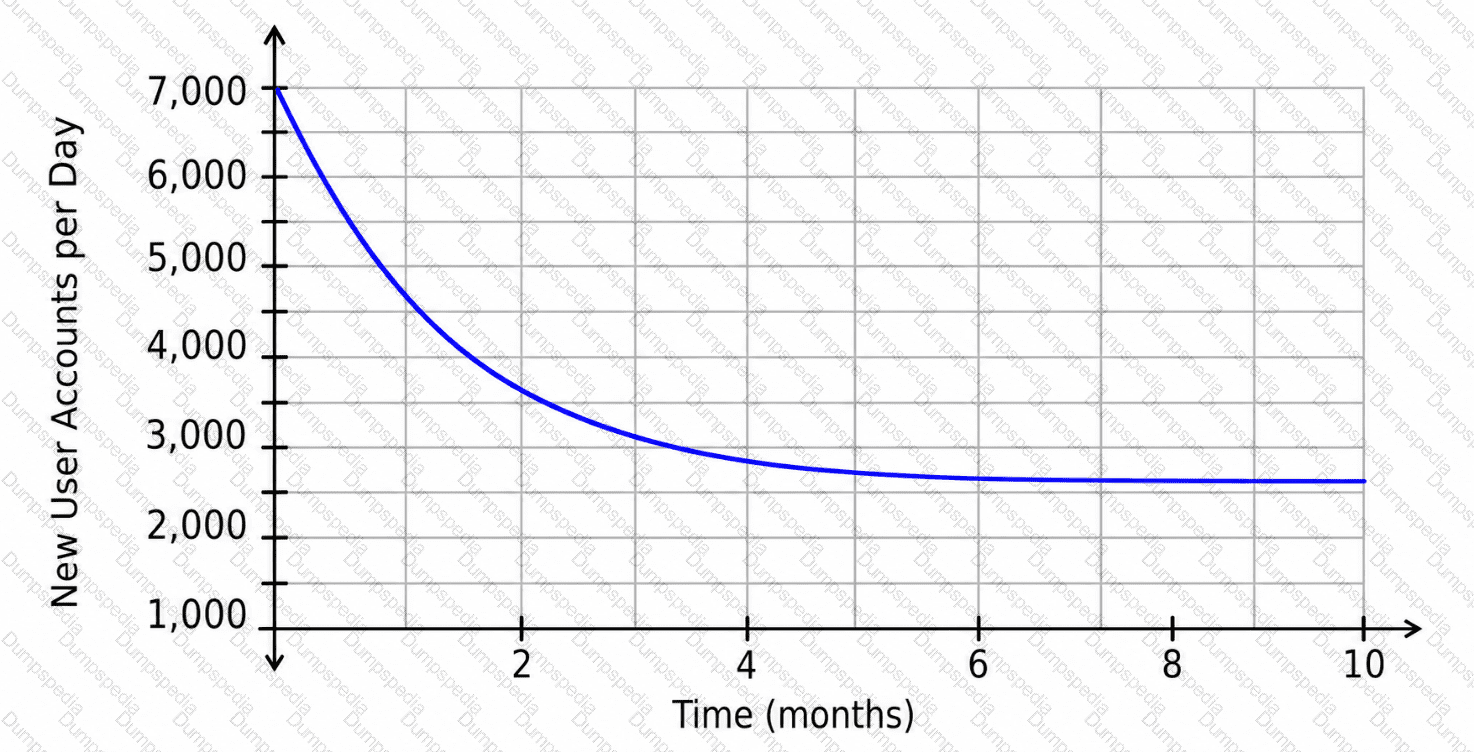
Which statement is justified considering the location of the horizontal asymptote?
A researcher collected data on the average selling price for tickets to a concert over time. The results are shown in the scatterplot. A regression function is graphed with r
2
=0.56. The predicted average selling price for tickets after 10.8 days is $167.20.
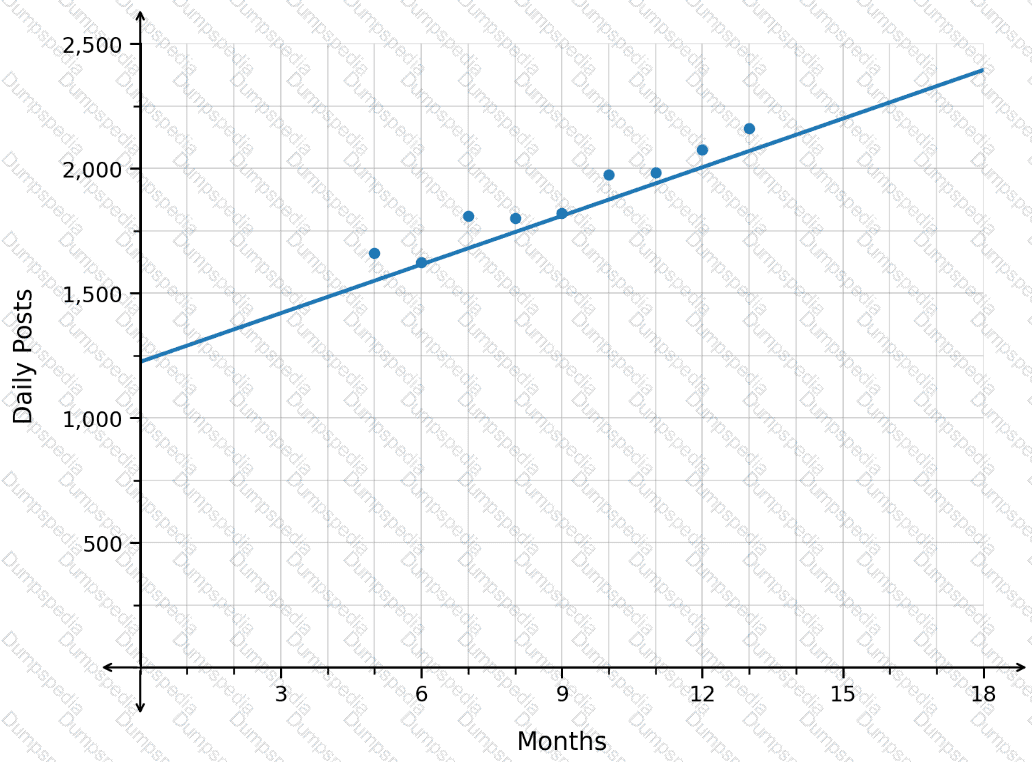
Is this prediction appropriate?
The population of fish in a lake is changing according to the function
P(t)=24t+185
where tis the number of months since the beginning of the year and P(t)is the fish population at time t.
Which interpretation of the rate of change is correct?
The number of property sales in a region this year is expected to be 9 more than the number of property sales in the region last year. The function H(x) represents the number of property sales this year, where x represents the number of properties sold last year.
Which notation represents the number of property sales this year, given that the number of properties sold last year was 140?
A new company just launched and is using the function M(t) to predict its market share after t years. The graph of M(t) is shown.
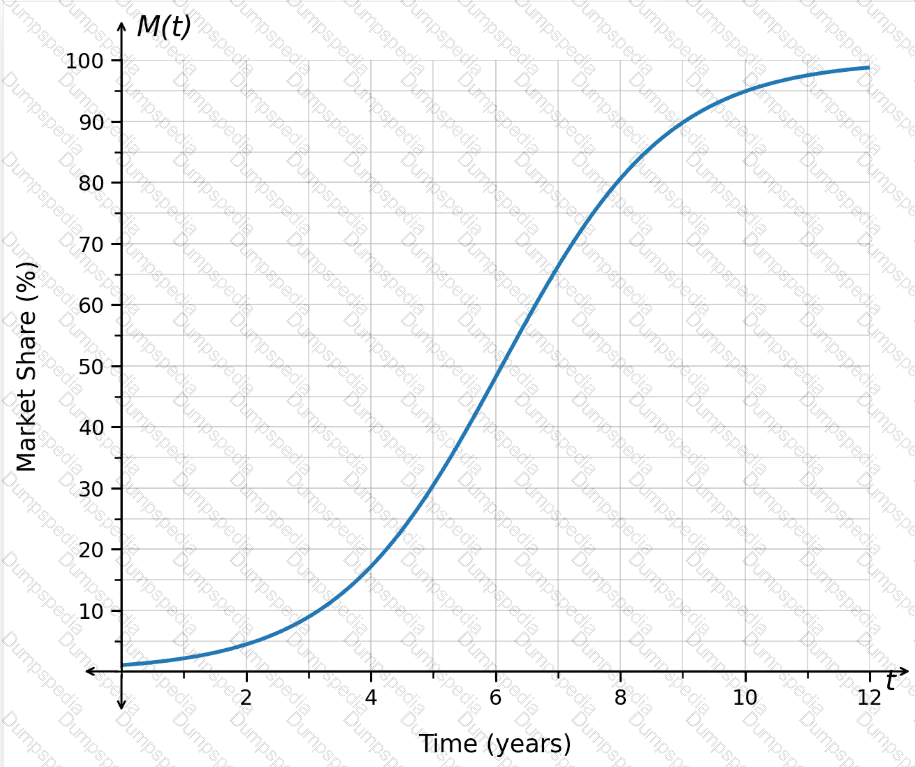
When should the company expect to have a market share of 60%?
A researcher collected data on the average number of product returns per month to a company over time. The results are shown in the scatterplot. The graphed regression function has an r
2
value of 0.45.
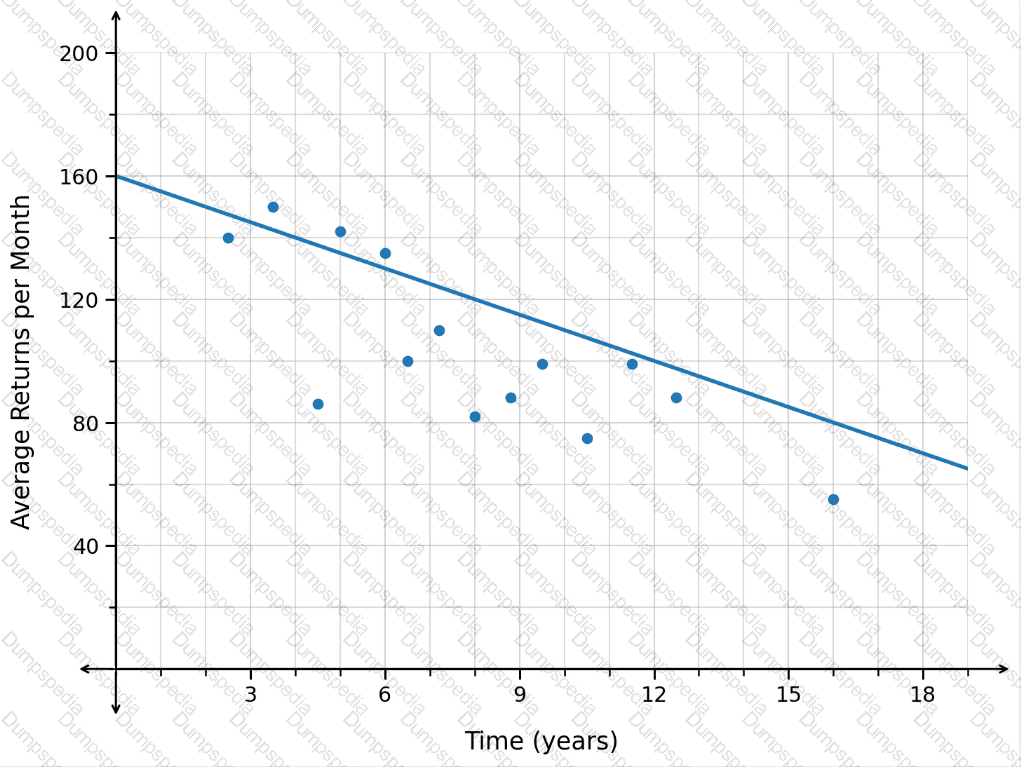
Which range of x-values is appropriate for extrapolation?
The function P(t)represents the yearly profit, in millions of dollars, for a streaming service since opening. The graph of P(t)is shown.
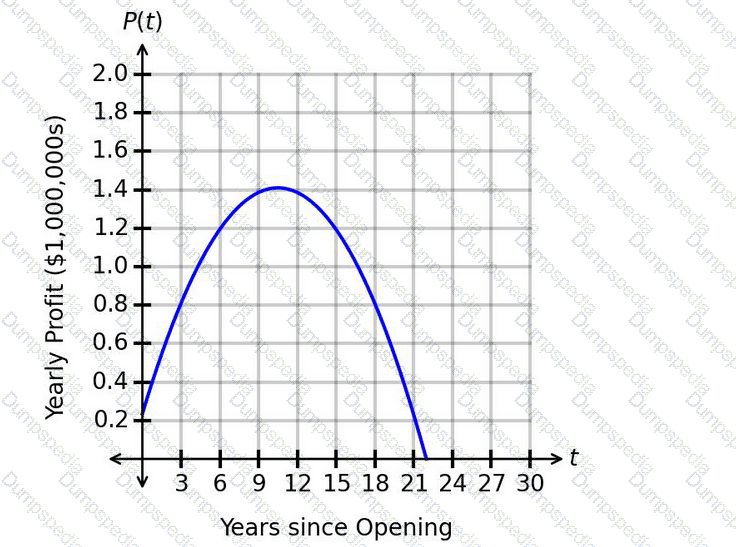
What is the correct interpretation of the maximum value?
The function F(n) represents the relationship between the number of animals in two enclosures, where n is the number of animals in enclosure A and F is the number of animals in enclosure B. The number of animals in enclosure B is 20 more than the number of animals in enclosure A.
Which function represents this situation?
In the graph showing the number of new customer accounts, the horizontal axis shows the number of weeks since the beginning of winter and the vertical axis shows the number of new customer accounts. More customer accounts are opened during snowy weeks than during weeks without snow.
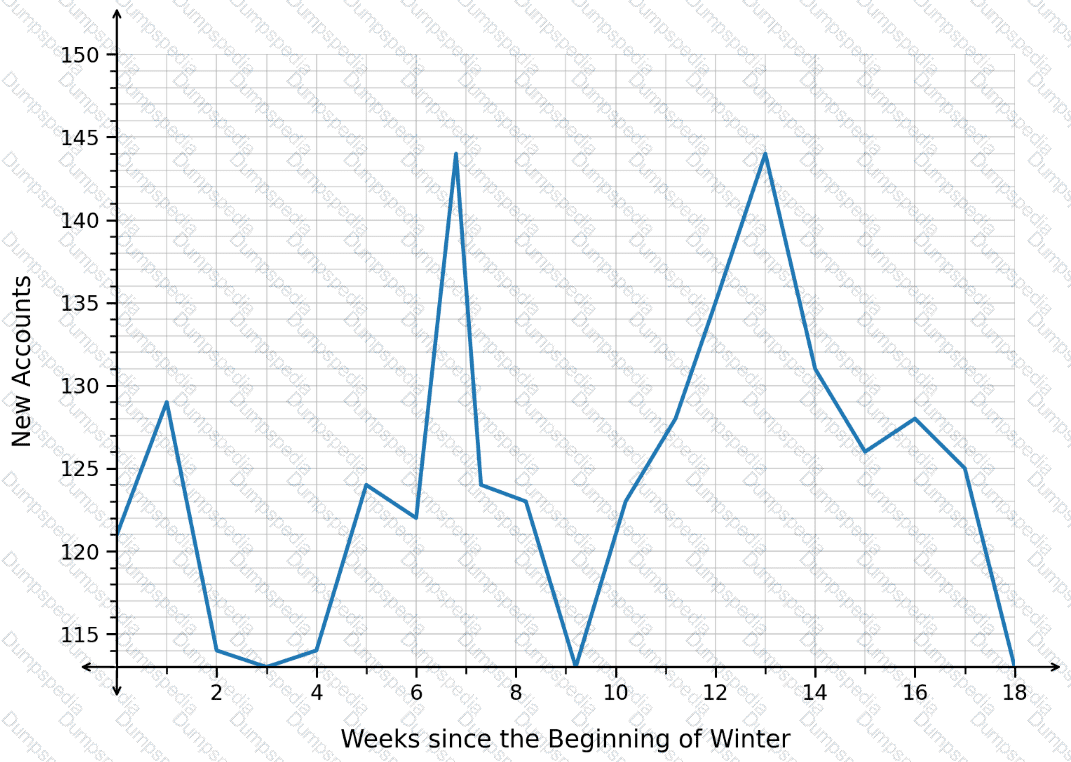
When was it likely snowy?
The exponential function
f(x)=280× 〖 1.08 〗 ^x
represents the number of subscribers to a blog, where xrepresents the number of years since 2003 and f(x)represents the number of subscribers.
Which statement correctly interprets the average rate of change of the number of subscribers from 2003 to 2007? Round to the nearest whole number, if necessary.
An investment account accrues interest every year, and the value of the account is given by G(x). The graph of this function is shown.
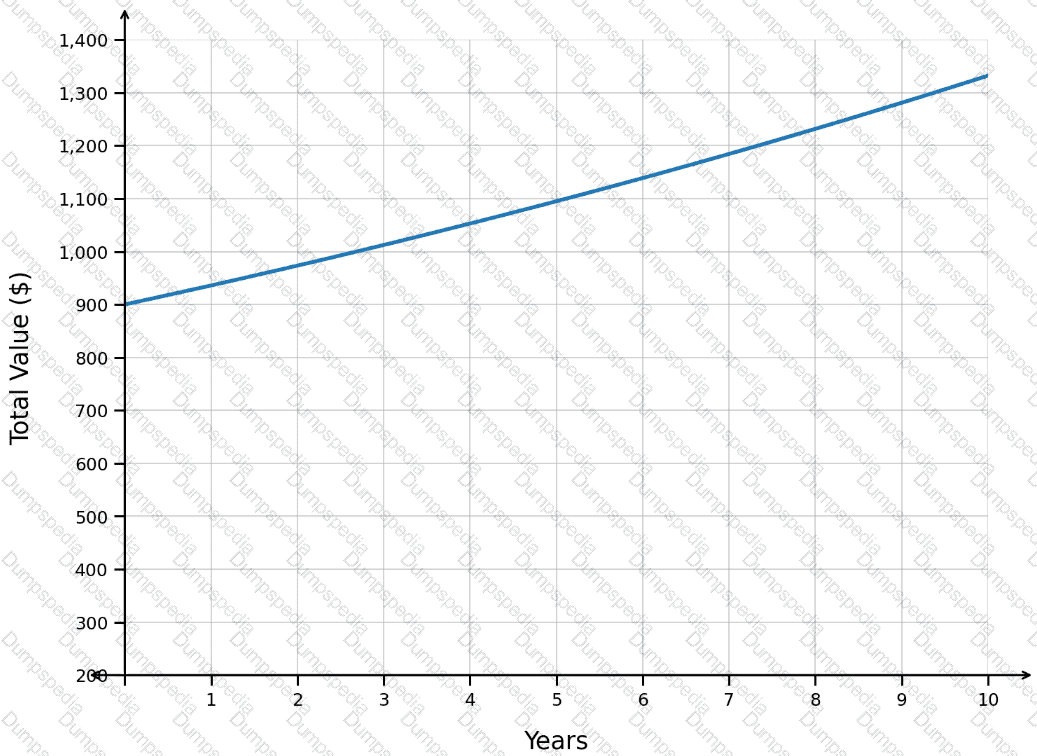
What represents the value of the account after 4 years?
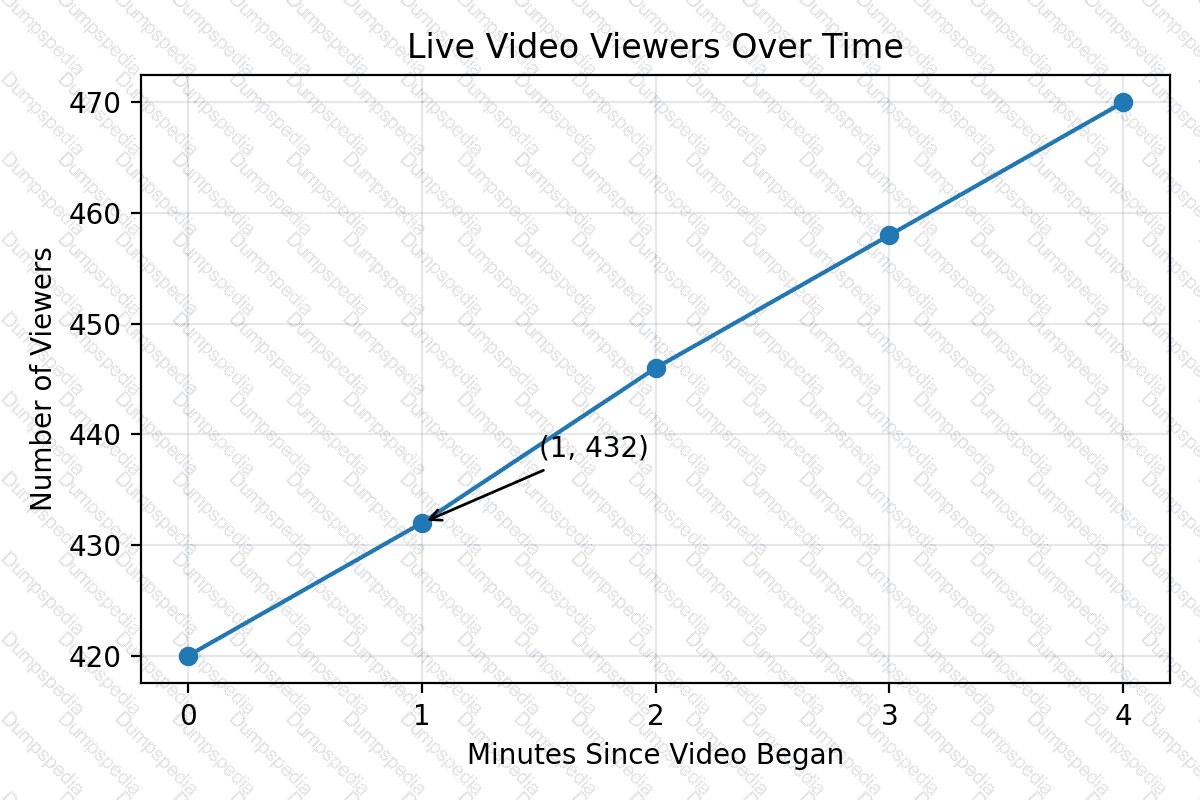
The graph shows the number of people watching a live video. The number of minutes since the video began is on the horizontal axis, and the number of viewers is on the vertical axis. When were there 432 viewers?
Exhibit:
The number of members of a religious organization can be modeled using the logistic function f(x), where xrepresents the number of years since the organization was started and f(x)represents the number of members. The graph of f(x)is shown.
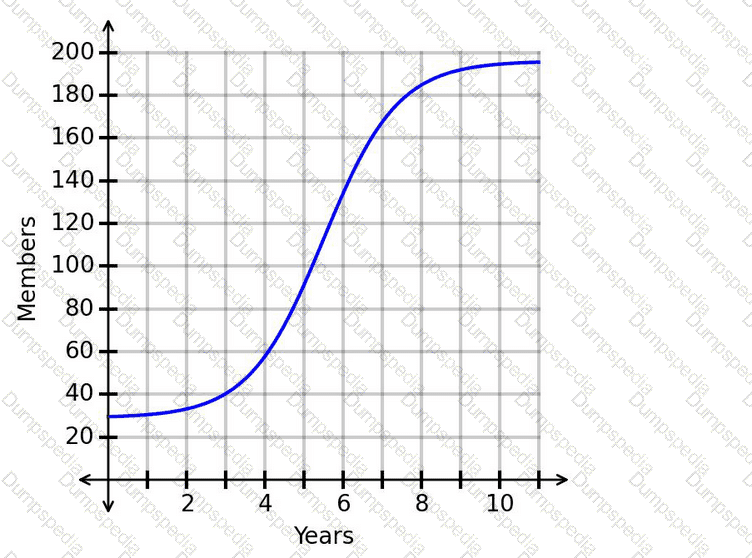
What is one range of values for which the graph is concave down?
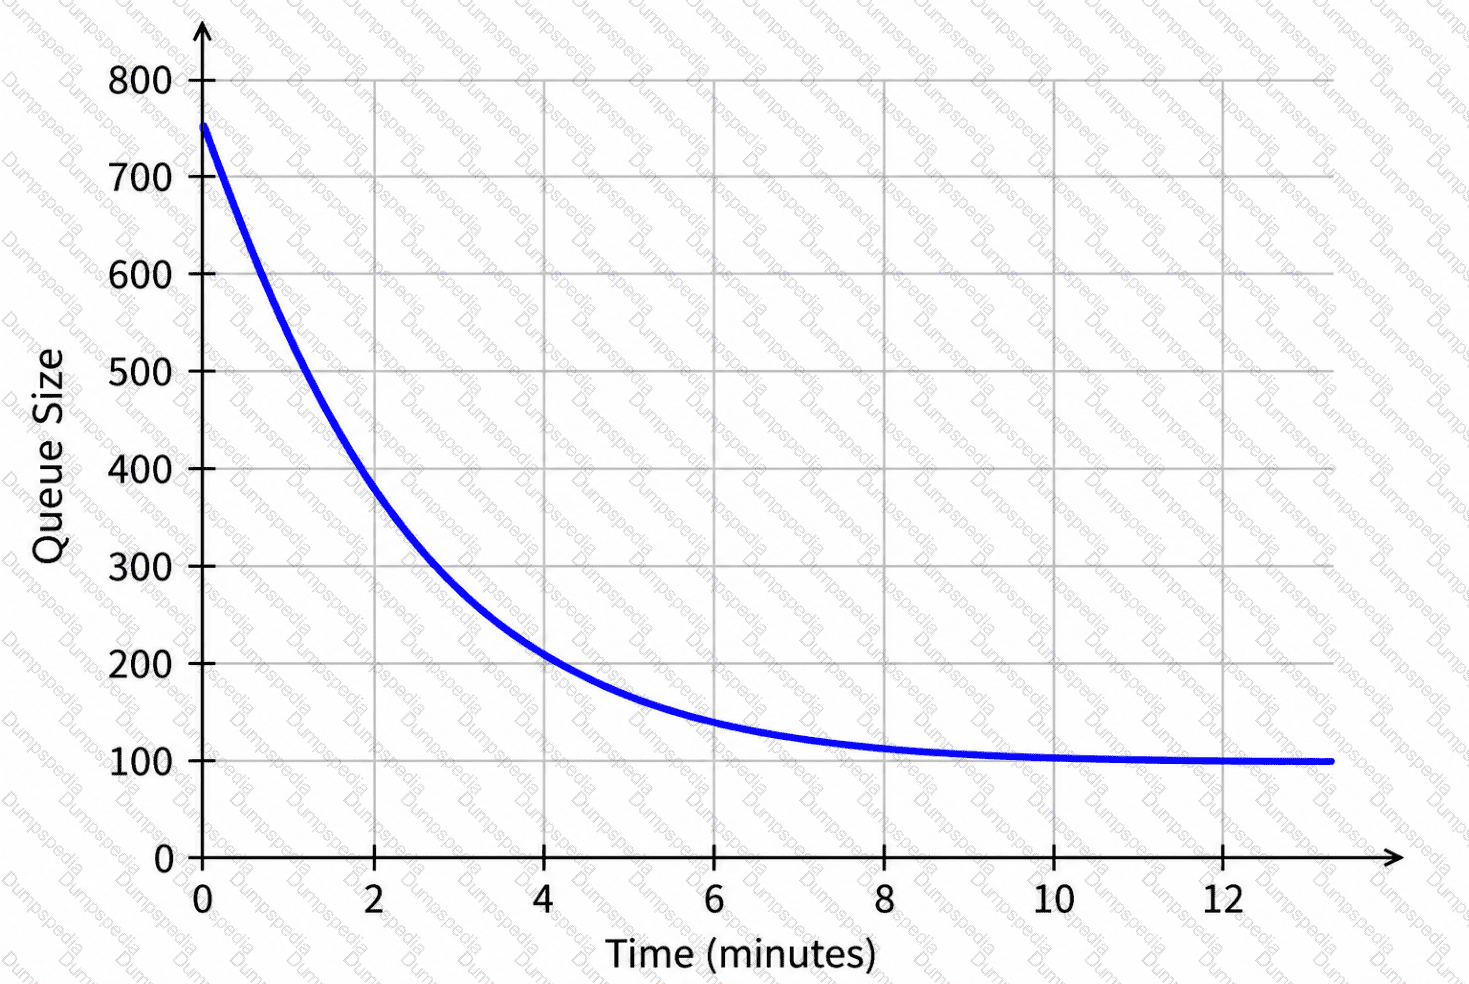
The graph shows the number of people waiting in a virtual queue to buy tickets for an event.
What does the horizontal asymptote mean?
As sacks are unloaded off a wagon, the total weight of the wagon and sacks changes. Each sack has the same weight. After 3 sacks are removed, the total weight of the cart and remaining sacks is 116 pounds. After 6 sacks are removed, the total weight is 101 pounds.
What is the weight of each sack?
A researcher collected data on the number of annual bear sightings in a region over time. The results are shown in the scatterplot. A regression function is graphed with r^2=0.42. The predicted number of annual bear sightings after 19.5years is 62.2.
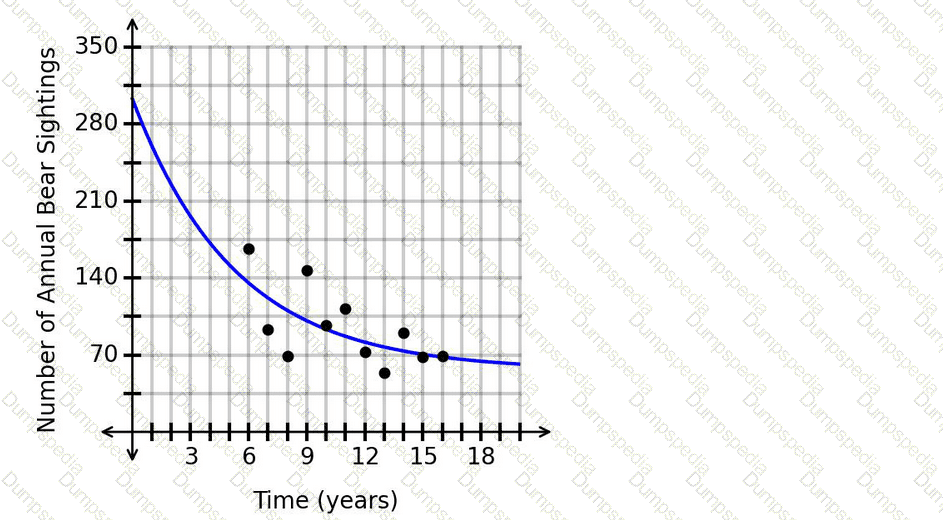
Is this prediction appropriate?
The value of a painting is represented by the function
f(x)=330× 〖 1.04 〗 ^x
In this function, xrepresents the number of years since 2004, and f(x)represents the value of the painting in dollars.
Which value represents the average yearly rate of change of the painting ' s value from 2013 to 2018?
The number of letters processed daily at a mail center is modeled by the decreasing exponential function shown in the graph.
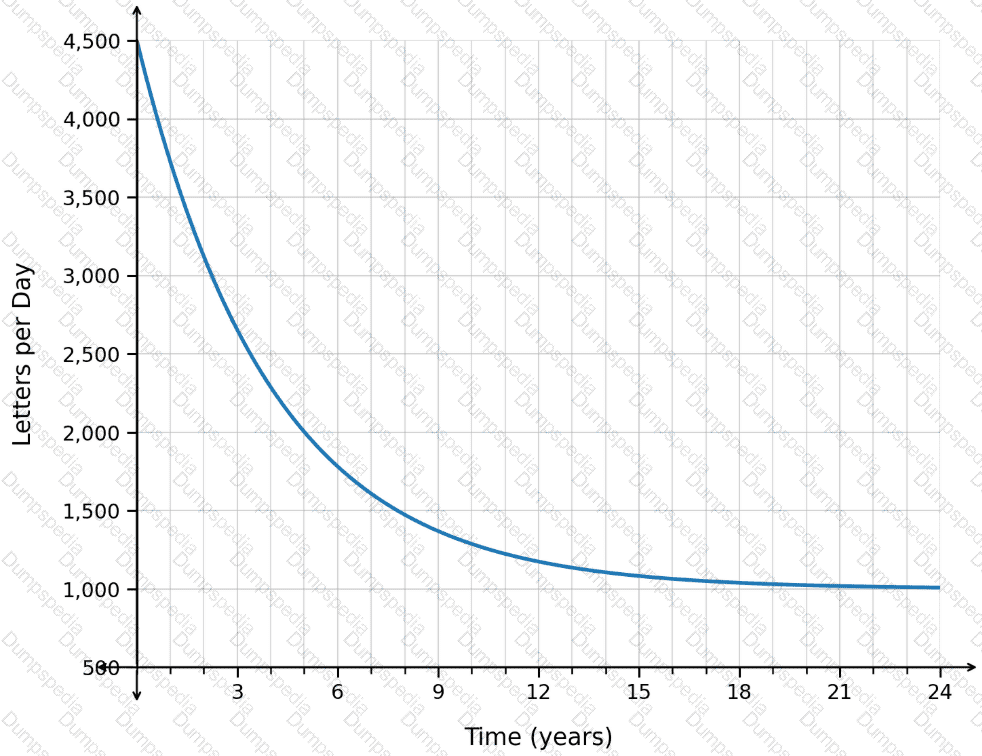
What is the long-term trend in the number of letters processed per day, based on the equation of the horizontal asymptote?
Consider the function
w(t)=0.03t^4-0.81t^3+7.55t^2-26.62t+44
which represents the number of workers, w, at a job site thours after 6:00 a.m.
What is the difference between w(4)and w(8)?
The number of daily raffle tickets sold, R(d), for a fundraiser is represented by the graph, with the number of days since the beginning of the month along the horizontal axis and the number of raffle tickets sold for the day along the vertical axis.
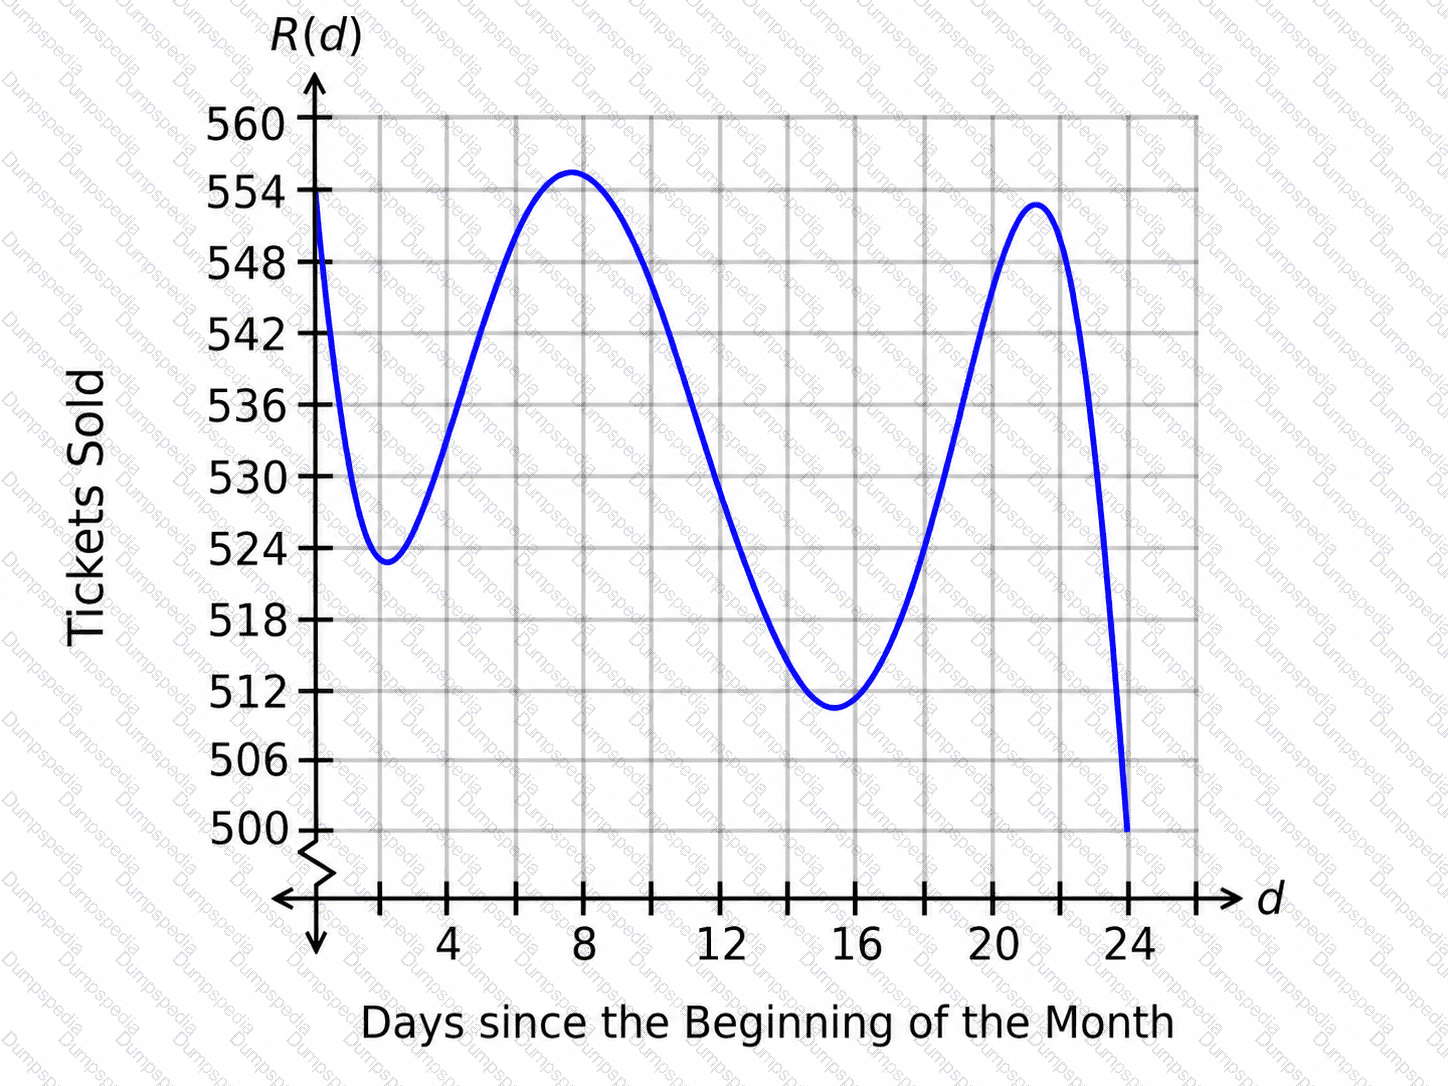
How can the concavity be described from d=0to d=4.4?
The number of comments on a social media post is represented by the logistic function f(x), whose graph is shown, where xrepresents the number of days since the post was created and f(x)represents the number of comments on day x.
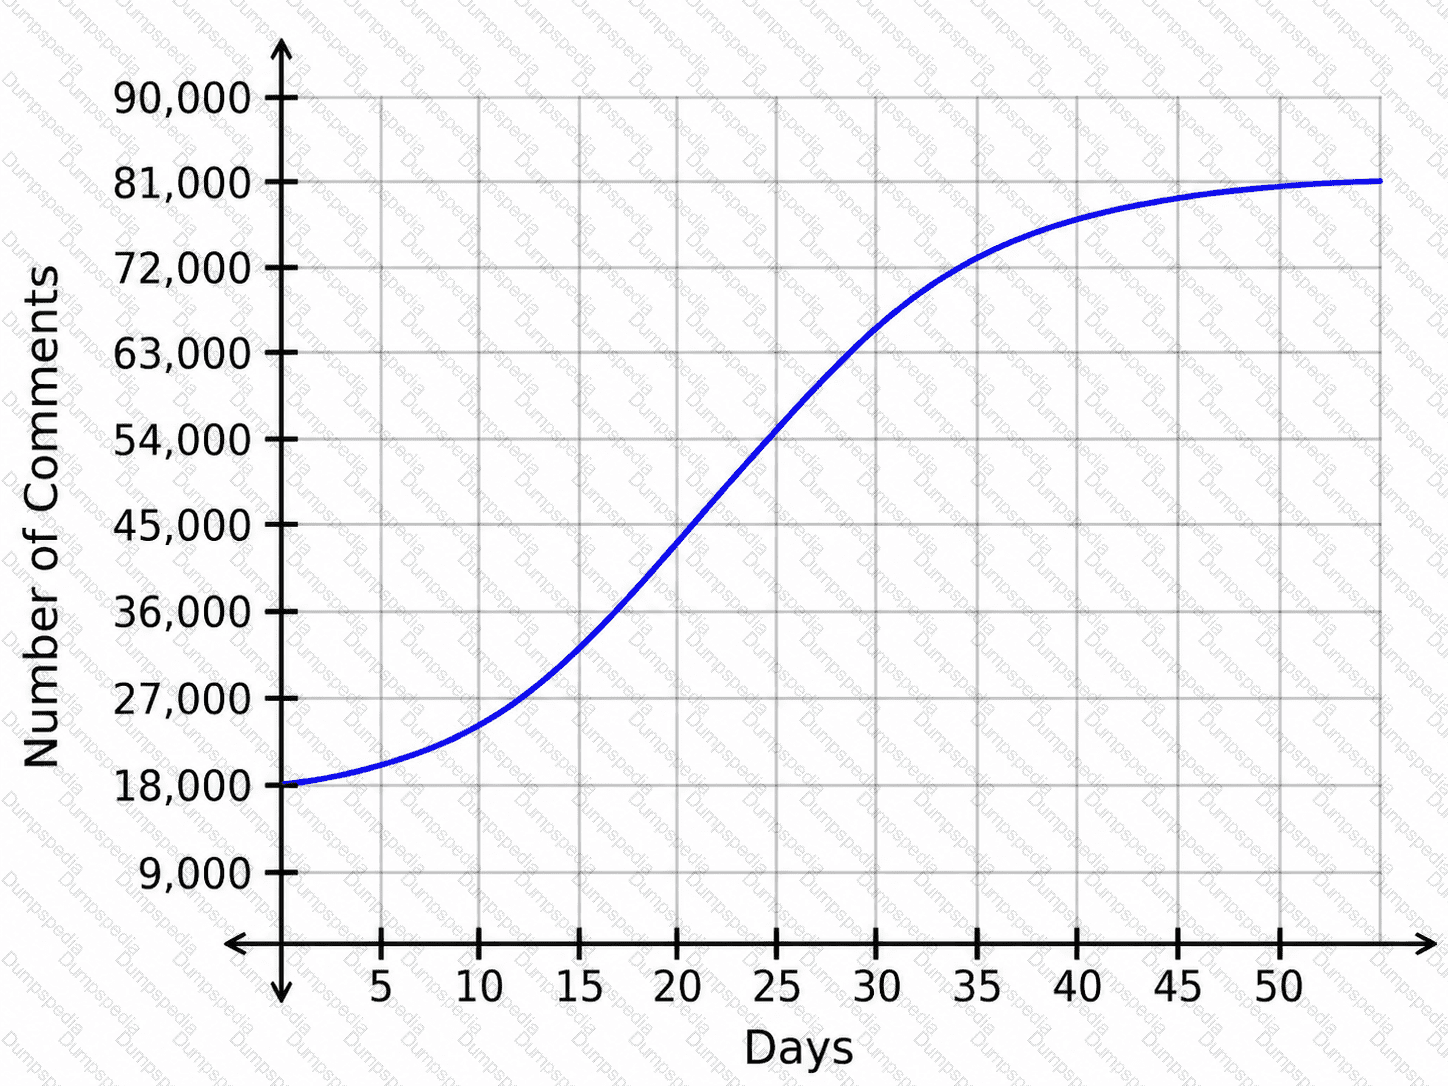
How does the number of comments change as time progresses from day 1 to day 17?
Which statement correctly interprets u(8), given that u(t)=0.21t
3
−4.09t
2
+18.89t+69.5 represents the number of units, u, in an inventory warehouse t hours after 9:00 a.m.?
Consider the function I(m)=41m²−490m+30, which represents the daily income, I, in dollars, of a store based on the number of months, m, since the beginning of the year. What is the difference between I(7) and I(9)?
The number of wild horses in a federal park is represented by the logistic function f(x), whose graph is shown, where xrepresents the number of years since the park was established and f(x)represents the wild horse population in a given year.
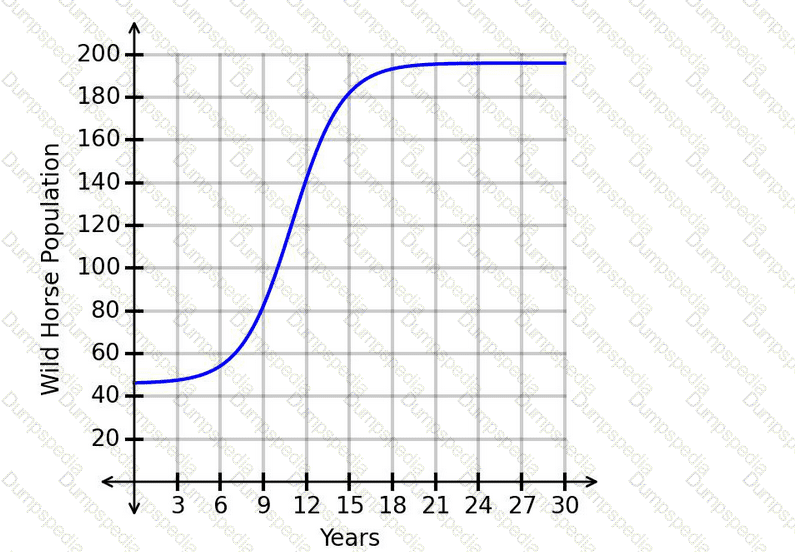
How does the number of wild horses change as time progresses from year 1 to year 9?
The value of a collectible artifact is represented by the function
f(x)=330× 〖 1.15 〗 ^x
In this function, xrepresents the number of years since 2005, and f(x)represents the value of the artifact, in dollars.
Which value represents the average yearly rate of change of the value of the artifact from 2006 to 2011?
The function f(n) represents the relationship between the distances traveled by two vehicles, where n is the distance traveled by vehicle A and f is the distance traveled by vehicle B. The distance traveled by vehicle B is 17 more than the distance traveled by vehicle A.
Which function represents this situation?
The graph shows the number of customers, C(t), showing up to a store, where the number of hours since opening is along the horizontal axis and the number of customers showing up to the store each hour is along the vertical axis.
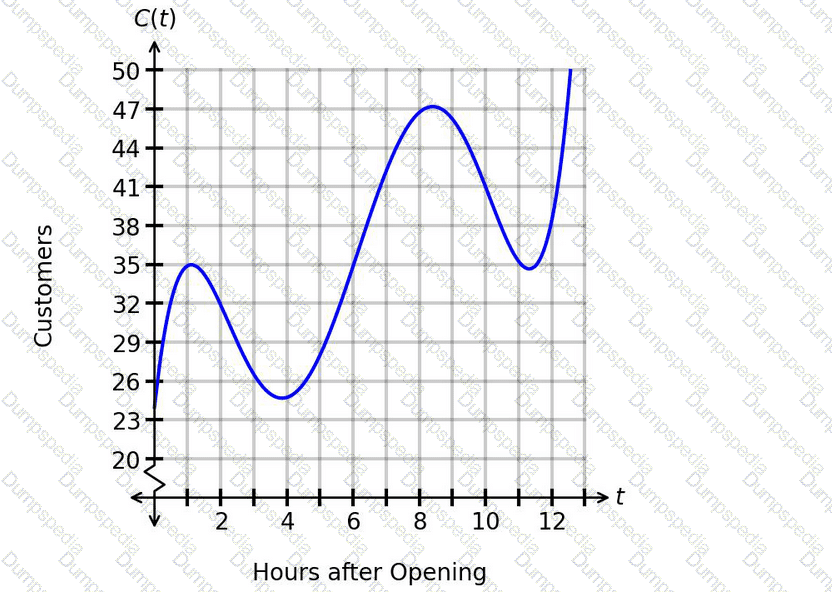
How can the concavity be described from t=6.2to t=10.1?
The number of property sales in a region this year is expected to be 8 times the number of property sales in the region last year. The function H(x)represents the number of property sales this year, where xrepresents the number of properties sold last year.
Which notation represents the number of property sales this year, given that the number of properties sold last year was 360?
An exponential growth function can be used to model the number of bacteria in a population. The function
G(t)=1,600× 〖 1.31 〗 ^t
is the model, with Grepresenting the number of bacteria cells and trepresenting the time in minutes.
What is the size of the population after 25 minutes?
The function p(t)represents the number of active players, p, in a game thours after 11:00 a.m. The graph of p(t)is shown.
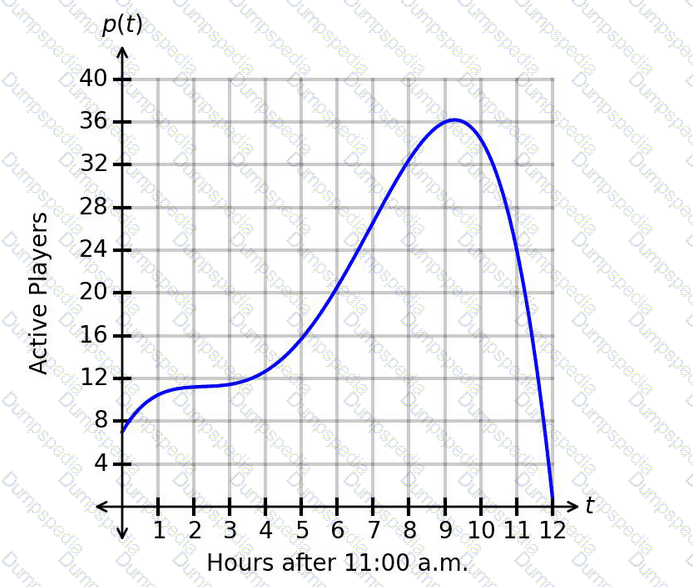
What is one example of an interval for which the number of players is decreasing faster and faster?
The number of people auditioning for a game show is expected to be 3 less than the number of people who auditioned last year. The function A(t)can be used to model the situation, where trepresents the number of people who auditioned last year and Arepresents the number of people expected to audition this year.
Which quantity represents the number of people expected to audition this year, given that 280 people auditioned last year?
In the graph showing the number of daily homework problems assigned for a math class, the horizontal axis shows the number of school days since the beginning of the term and the vertical axis shows the number of daily homework problems.
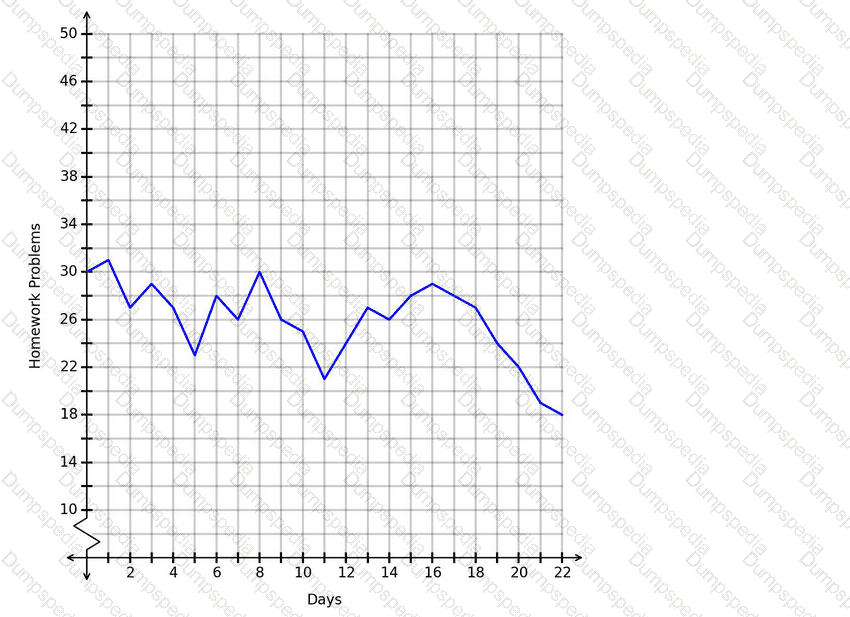
Which conclusion is correct based on this graph?
The populations, in thousands, of two towns are shown in the graph, where the horizontal axis measures the time in years.
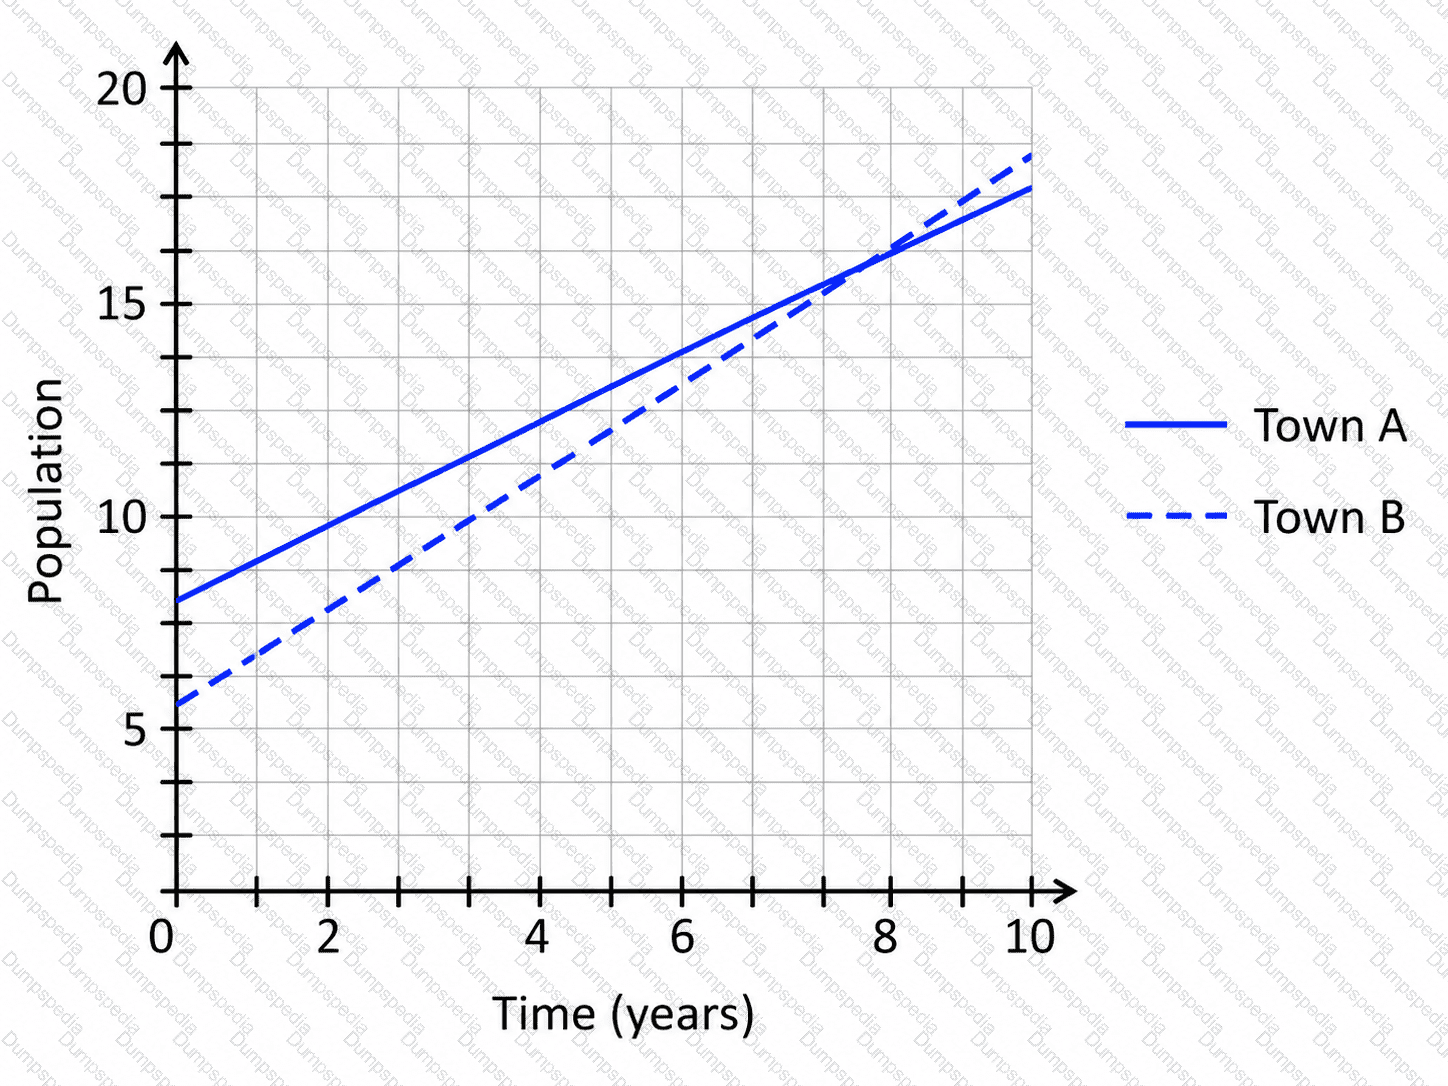
Which town’s population is growing at a faster rate?
As a drone travels away from an operator, the function G(x)=24+47x models the distance, in yards, between the drone and the operator at x minutes. What is the value of G(1.9)?
A recipe calls for a constant ratio of water and lemon juice. The graph shows the relationship between the amounts of these two ingredients, where wis the volume of water and lis the volume of lemon juice.
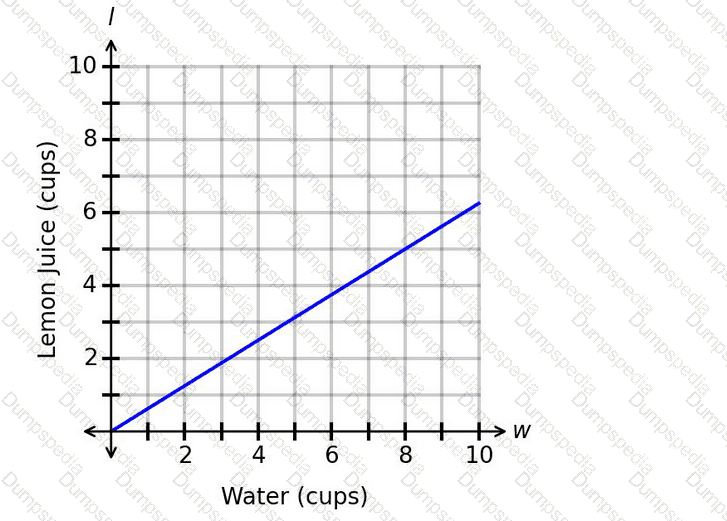
What is the correct interpretation of the rate of change?

TESTED 15 Oct 2026