A normal population has a known variance of 5.9 mm². What sample size would be required to obtain a 95% confidence interval for a mean that is ±0.5 mm wide?
A team is concerned that the read-write time on their hard drives will be affected by a mandated repair. The team collects data on hard drives before and after they are repaired. To determine the performance differences on each drive, which of the following tests should be used?
Which of the following methods can be used as part of product design to prevent component parts from being assembled incorrectly?
A Six Sigma team is reviewing the following data from a 2-sample t-test on Unit 1 and Unit 2 of a product. Variances are not assumed to be equal.
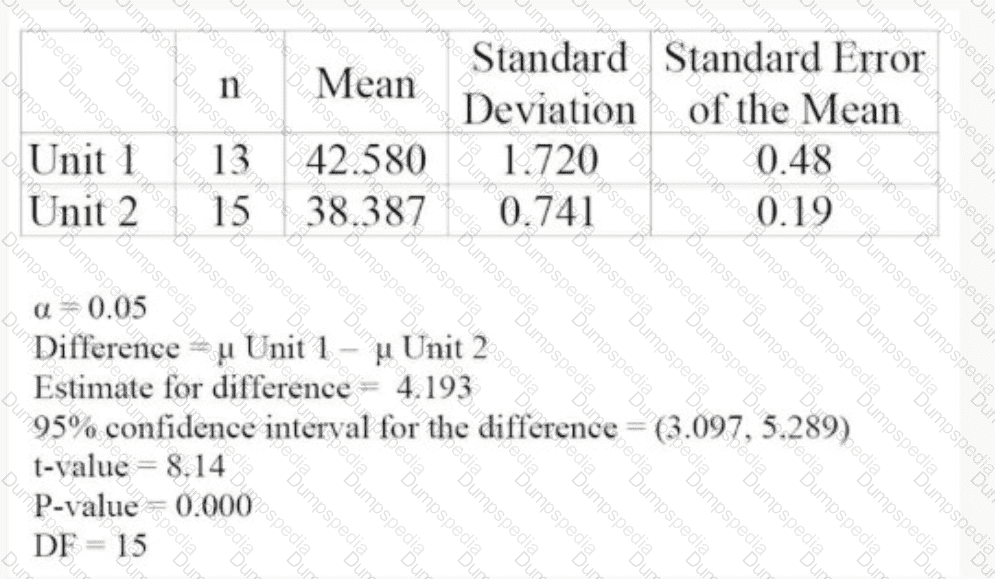
On the basis of this information below, which of the following conclusions would be appropriate to draw from this test?
A bottle-filling operation is required to fill glass bottles with 16–17 ounces per fill. Fill levels are normally distributed. When a customer requested a process capability study, the company sampled 4 bottles every half hour over five 8-hour shifts. The mean fill level for this sample was X̄ = 16.4 and the fill range was 15.9–16.8 with R̄ = 0.6. What is the short-term process capability index for this process?
Which of the following descriptions best defines an organization’s measurement system?
As DMAIC projects are rolled out to process owners and staff, training needs to focus on
Based on the ANOVA information shown, how many factors are statistically significant?
What is the first step in launching a total productive maintenance (TPM) program?
A commuter wants to determine which of two routes to take to work. If route X appears to have more traffic than route Y, the commuter should test which of the following null hypotheses?
Which of the following actions should be taken during the control phase of a project?
In the factorial design main-effects plot shown, which factor setting gives the lower response?
Which of the following control charts should a manufacturer use to measure the number of products rejected due to nonconformance?
A team has calculated the following invoice processing time for accounting personnel. What is the employee’s takt time?
Time in the workday: 8 hours
Time for meetings and breaks: 1 hour
Total work time per invoice: 5 minutes
Invoices required: 60 per day
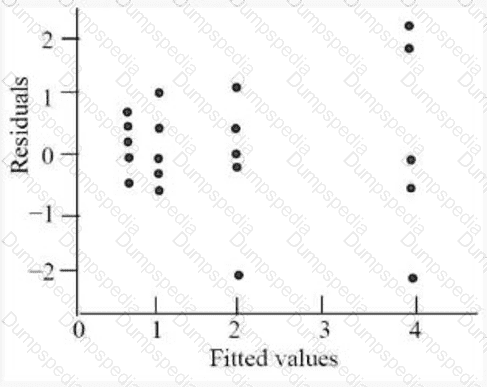
A team developed the following plot to compare residuals versus fitted values. On the basis of this plot, which of the following conclusions can be drawn, if any?
After gathering data from a benchmarking study, the team should develop a gap analysis to
Which of the following analyses is used to classify observations into two or more groups when there are multiple known groups?
A healthcare company is preparing to implement a new electronic medical records database system. The IT team has warned management about possible problems that could occur during and immediately after implementation, such as missing patient accounts, missing lab values, and incorrect medication order sets. Which of the following tools should management use to mitigate these risks?
In a normal distribution, the sum of the deviations of data about the mean approaches
A factory worker collected the performance data of a product over the period of one week. A normal probability plot of the data confirmed that the collected data is not normal. The factory worker intends to transform the data to produce a second variable that is normally distributed. Which of the following transformations should be used?
Which of the following factors is a consideration in design for maintainability?
Which of the following tools identifies stakeholders when undertaking a process change?
Which of the following elements should a team include in the control plan for a revised process?
Design of experiments (DOE) trials that are made under identical conditions represent which of the following concepts?
A team should use a prioritization matrix in order to respond effectively to which of the following situations?
A company can classify certain defects as “worker-controllable” only if the workers are allowed to
A benchmarking team has been formed to conduct studies on various internal processes to determine best practices. Between team meetings, members are responsible for completing which of the following tasks?
A patient arrives at the clinic at noon and was called into an exam room at 12:43 pm by a nurse for a blood draw. The blood draw tubes were not available in the exam room, so the nurse went to the clinic supply room and found that no blood draw tubes were left. In addition to waiting, which of the following forms of waste were present?
Which of the following is the best tool to use to identify the specific tasks needed to complete a project?
Once a company has developed metrics for a balanced scorecard, the metrics are used primarily to
In measurement system analysis, both the 10:1 rule and the 4:1 rule are based on the
Which of the following conditions is a typical organizational roadblock to a Six Sigma program?
In the Theory of Constraints, the performance of a series of interconnected processes is driven by the performance of the
The process of requisitioning, ordering, and obtaining purchased material has been causing conflicts among three different departments. Representatives of each department have formed a cross-functional team to do process mapping to define all the elements of the process and to redesign the process as appropriate. The team has reached agreement on the flaws of the existing process based on the analysis of process data and clear process maps. The next logical step would be for the team to
Which of the following tools should be used to gain a clear picture of a business process when trying to find opportunities for improvement?
Which of the following tools can be used to organize and summarize a large number of ideas?
Which of the following criteria should be used to select rational subgroups for control chart sampling?
Which of the following tools is used to improve product development, order-processing, and production activities on an ongoing basis?
Which of the following tools can be converted to a frequency distribution most easily?
A process has a specification of 5.2 ± 0.3 and yields the following data:
What is the Ppk of the process?
Which of the following terms is defined as the ratio of value-added time to total lead time?
During the design stage of a product or service, functional requirements are developed in order to
The best time to get stakeholder support and commitment for a project is immediately after the
The primary reason for identifying both the internal and external customers of a process is to
Based on the chart comparing monthly performance of Facilities X and Y, which facility had the lower value in January and which had the lower value in February?
During which of the following phases of DSIADV would a Black Belt start developing a process map?
According to Deming, which of the following tools should be used to conduct an analytic study rather than an enumerative study?
Which of the following activities occurs during the Measure phase of a DMADV project?
In hypothesis testing, if α = 0.05 and β = 0.10, what is the power of the test?
The top management of an organization resists change and does not want to spend resources on continuous improvement. Which of the following methods should be used first to convince top management that continuous improvement can be effective in the organization?
Which of the following Theory of Constraints (TOC) elements is designed to decrease inventory or investment?
Which of the following formulas represents the standard deviation of the sampling distribution of the sample mean?
A stable, normally distributed process has a mean of 503 and a standard deviation of 4. If the specification is 500 ± 10, with a target of 500, what is the Cpm value?
A Black Belt tells a project team, “For our control charts, we need samples that are as homogeneous as possible and that allow the maximum opportunity for variation between them.” The Black Belt is describing
If the number of occurrences of a certain event during a defined time interval follows a Poisson distribution, and is constant over time, the amount of time that elapses between occurrences is
Which of the following analytical tools identifies the events that can go wrong, and the appropriate countermeasures for those events?
If a Six Sigma Black Belt estimates that investing $200,000 in a project will result in a savings of $700,000, what is the project’s return on investment (ROI)?
When managing virtual teams across virtual offices, a quality manager will often question the traditional
Which of the following tools should be used to convert a broad goal into increasingly detailed levels?
Which design for X involves the team recognizing that limitations may exist with respect to creation of a product?
In a one-factor analysis of variance with five treatment groups, the sample sizes are [source text incomplete in the provided prompt]. How many degrees of freedom are there for the error term?
A credit approval process has a Cp = 1.33 with a mean of 120 minutes and a tolerance of ±10 minutes. What does the short-term standard deviation have to be in order to achieve a Cp = 1.67?
Which of the following performance measures in a balanced scorecard would have KPIs that are considered predictors for the metrics related to employee satisfaction, absentee rate, and employee turnover rate?
A Six Sigma Black Belt is using the RACI matrix and needs to make a major decision for the current project. Which of the following stakeholder groups is not necessary?
A process improvement team needs to determine whether there is a sufficient cost-benefit to warrant continuing a machine rebuild effort. Which of the following tools should the team use to make this decision?

TESTED 16 Jul 2026