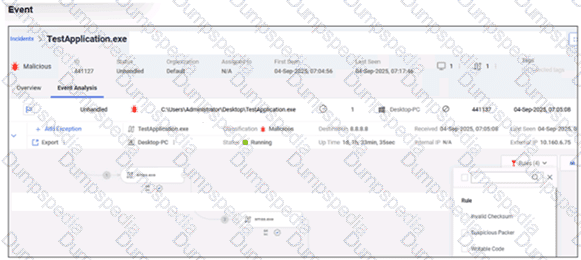
Refer to the exhibit.

Based on the event shown in the exhibit, which two statements about the event are true? (Choose two answers)
The event is marked as Handled.
FCS classified the event as malicious.
The user was able to launch TestApplication.exe.
TestApplication.exe is sophisticated malware.
The correct answers are B and C .
The exhibit shows the event classification as Malicious . In FortiEDR, event classification can be performed by the Core and later updated by FortiEDR Cloud Service (FCS) . The guide states that the audit history shows the classification chronology and includes details when FCS reclassifies a security event after the Core’s initial classification. It also states that notifications can be based on either Core or FCS classification depending on whether FCS classification is received within the timeout period.
The exhibit also shows TestApplication.exe with Status: Running . That means the process was launched and is currently running on the endpoint. Therefore, C is correct.
Option A is wrong because the exhibit clearly shows Status: Unhandled , not Handled. The guide states that FortiEDR security events are initially marked as unread and unhandled, and users can later mark them handled through the incident handling workflow.
Option D is wrong because the exhibit shows rule indicators such as Invalid Checksum , Suspicious Packer , and Writable Code , but it does not prove that TestApplication.exe is “sophisticated malware.” FortiEDR classifies the event as malicious, but the guide’s Malicious classification means the event is verified to have malicious capability, is intended to harm the infected device, and has no commercially viable use; the exhibit alone does not justify the stronger claim “sophisticated malware.”
=========
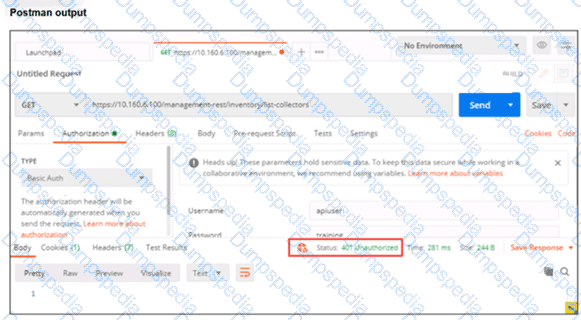
Refer to Exhibit.

Based on the Postman output shown in the exhibit, why is the user receiving an unauthorized error? (Choose one answer)
The central manager is rejecting the request because of an unsupported HTTP method.
API access is disabled on the central manager.
The user account does not have the REST API role assigned.
FortiEDR requires a password reset the first time a user logs in.
The correct answer is C. The user account does not have the REST API role assigned .
The exhibit shows a Postman request to the FortiEDR Central Manager REST endpoint:
/management-rest/inventory/list-collectors
The response is 401 Unauthorized , which means the request reached the FortiEDR API endpoint but the supplied user credentials are not authorized for REST API access.
The FortiEDR 7.0.0 Administration Guide states that when adding or editing a user, the Rest API advanced option controls whether the user is allowed to access the FortiEDR Central Manager through API calls. The guide defines this option as: “Rest API — Specifies whether to allow the user to access the FortiEDR Central Manager through API calls.”
Therefore, the most accurate cause is that the account being used in Postman does not have the Rest API permission enabled.
Option A is incorrect because the request uses GET against a list endpoint, and an unsupported method would not normally be represented by this user-authentication failure. Option B is not supported by the exhibit or guide wording; the guide describes enabling REST API access per user. Option D is incorrect because first-login password reset is not the direct cause of this REST API authorization failure. The guide separately discusses password reset and password policy behavior, but that is not what the API error indicates.
A playbook is configured with two actions: terminate process and isolate device. The terminate process action fails because the process is protected by Windows. What is the expected behavior for the second action, isolate device? (Choose one answer)
The playbook execution pauses and requires administrator intervention.
The playbook generates a notification email and execution stops.
The playbook execution stops because the action fails.
The playbook continues and executes the second action.
The correct answer is D .
The FortiEDR guide confirms that Playbook actions are automatic incident response actions configured under Security Settings > Playbooks and applied based on security event classification. It also confirms that actions such as Terminate Process and device isolation actions can be configured as playbook responses. For scheduled-query-triggered events, the guide states that FortiEDR can automatically apply the Playbook action assigned to the Collector Group that the triggering device belongs to.
For isolation, the guide shows that isolation actions such as Isolate device with NAC are configured under the Investigation section of Playbooks, and similar isolation actions are triggered automatically when selected for the relevant classification.
The uploaded guide does not provide a specific line saying “if terminate process fails, continue to the next action.” Based on FortiEDR playbook behavior, configured actions are executed independently. A failure to terminate a protected Windows process does not automatically cancel the remaining playbook actions. Therefore, the next configured action, isolate device , is still executed.
Options A , B , and C are wrong because the playbook does not pause for administrator intervention, does not stop merely because an email is generated, and does not cancel all remaining configured actions because one action failed.
=========
You discovered that a newly installed collector does not display on the Inventory tab in the central manager. Which two troubleshooting steps must you perform? (Choose two answers)
Verify that the central manager can resolve the collector hostname through DNS.
Verify that TCP ports 8081 and 555 are open between the collector and the central manager.
Check whether the FortiEDR services are running on the collector device.
Export and review the collector logs from the Central Manager for connection errors.
The correct answers are B and C .
The FortiEDR 7.0.0 Administration Guide has a specific troubleshooting section named “A FortiEDR Collector does not display in the INVENTORY tab.” It states that after a Collector is first launched, it registers with the FortiEDR Central Manager and appears in the Inventory tab. If it does not appear, the first checks are to confirm that the device where the Collector is installed is powered on and has Internet connectivity, and to validate that ports 8081 and 555 are available and not blocked by another third-party product.
Option B is therefore correct in the exam sense because ports 8081 and 555 must be open for FortiEDR communication. More precisely, the Collector communicates with the Aggregator on port 8081 and the Core on port 555 , not directly to the Central Manager in every architecture. The option wording says “between the collector and the central manager,” which is technically loose, but the required troubleshooting item is still the port availability.
Option C is also correct because the same guide says to check that the endpoint is powered on and connected. In practical FortiEDR troubleshooting, this includes confirming the FortiEDR Collector service/driver are running on the endpoint; otherwise the Collector cannot register or report health.
Option A is not listed in the FortiEDR guide as a required step for this issue. Option D is not the best answer because the guide says logs are generally retrieved when Fortinet Support requests them, and Collector logs can only be exported for Collectors in Running status; a newly installed Collector that does not appear in Inventory cannot normally be selected from Central Manager for log export.
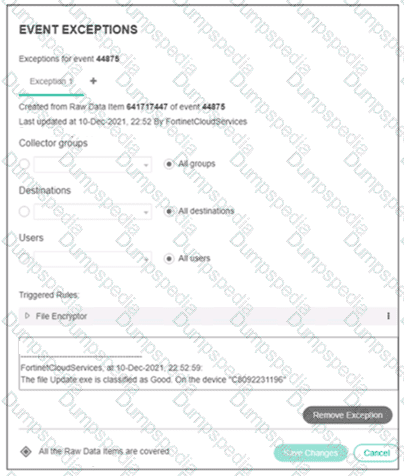
Refer to the exhibit.

An event exception is shown. Which two statements about the exception are true? (Choose two answers)
A partial exception is applied to this event.
The exception is applied only on device C8092231196.
The system owner can modify the trigger rules parameters.
FCS playbooks are enabled by Fortinet support.
The correct answers are C and D .
The exhibit shows an exception created/updated by FortinetCloudServices after the file Update.exe was classified as Good . This aligns with the FortiEDR Cloud Service behavior described in the guide. The guide states that once FCS is connected, it can enable Tuning , which means automated security event exception/allowlisting. After a triggered security event is reclassified as Safe, an automated cross-environment exception can be pushed downstream and the event expires, preventing it from triggering again.
Option C is correct because the Event Exceptions window includes Triggered Rules , and the guide states that when editing an exception, the administrator can modify the Collector Groups , Destinations , Users , and the pairs of rules and processes that define the exception in the Triggered Rules area.
Option D is the Fortinet/FCS-related statement supported by the guide’s FCS behavior. The guide says FCS can enable follow-up actions, including Tuning through automated exceptions and Playbook Actions , and that playbook policy remediation actions are based on the final FCS determination.
Option A is wrong because the exhibit explicitly states “All the Raw Data Items are covered.” A partial exception would mean not all raw data items are covered. The guide explains that if an exception does not cover all raw data items, FortiEDR displays a different indicator and distinguishes covered from non-covered raw data items.
Option B is wrong because the exception scope in the exhibit is set to All groups , All destinations , and All users . The comment references device C8092231196, but that is not the same as saying the exception applies only to that device.
=========
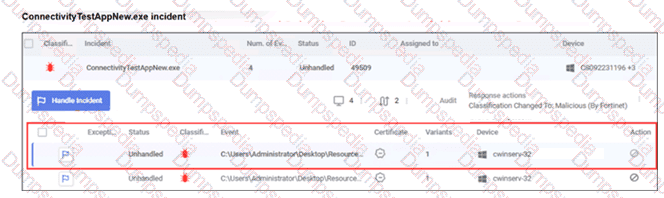
Refer to the exhibit.

What observation can you make about the ConnectivityTestAppNew.exe incident? (Choose one answer)
A rule assigned action is set to block but the policy is in simulation mode.
The incident has not been handled by a console administrator.
The incident was archived from the console unhandled.
The incident was handled automatically by the communication control policy.
The correct answer is B .
In the exhibit, the incident status clearly shows Unhandled at the incident level and also on the event rows. The FortiEDR guide explains that every detected security event is initially marked as unread and unhandled , and these statuses help multiple FortiEDR Central Manager users track whether anyone has read and handled the message.
The guide also states that when a FortiEDR Central Manager user marks a security event as Handled , all users see it as handled. The process is performed by selecting the event and clicking Handle Incident or the flag icon, then saving the incident handling details.
So the valid observation from the exhibit is that the incident has not been handled by a console administrator .
Option A is not supported by the exhibit. There is no visible evidence that the policy is in Simulation mode. Option C is wrong because the incident is still visible, not archived or deleted. Option D is wrong because the status is explicitly Unhandled ; it was not handled automatically by a Communication Control policy.
=========
Refer to the Exhibit:

Based on the incident details shown in the exhibit, which two statements about this incident are true? (Choose two answers)

The destination IP address is blocked by FortiGate.
The incident occurred on only one device.
The incident is classified by the FortiEDR Core.
The incident has already been fully handled.
The correct answers are A and C .
The exhibit shows an audit/response action stating that IP address 74.125.235.20 was added to malicious IP addresses on firewall FortiGate . This matches the FortiEDR playbook action Block address on Firewall . The guide states that this action ensures connections to remote malicious addresses associated with the security event are blocked, and that a firewall connector must already be configured for this action. It also explains that a checkmark in a classification column means communication with the affected destination is automatically blocked when a security event with that classification is triggered.
Option C is the second best answer because FortiEDR events are initially classified by FortiEDR detection logic/Core, and the guide states that classifications are initially determined by the Core but can later be changed automatically by FortiEDR Cloud Service or manually. The exhibit shows “Classification Changed To: Suspicious (By Fortinet)” , but it does not say the event was manually classified by an administrator. So the event classification process is FortiEDR-driven, with later Fortinet/FCS-style automatic classification possible.
Option B is wrong. The exhibit shows one raw-data row with device cwinserv-32 +2 , which indicates more than one affected device/raw item is represented in the aggregation. So it did not occur on only one device.
Option D is wrong because the incident rows clearly show Unhandled . The guide states that security events are initially marked as unread and unhandled, and the unread/unhandled status helps users track whether anyone has read and handled the event.
=========
TESTED 22 Nov 2026