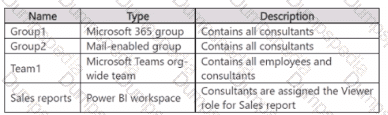
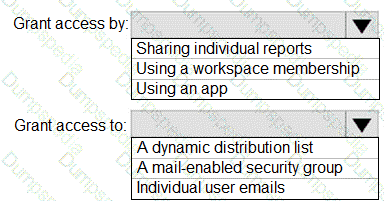
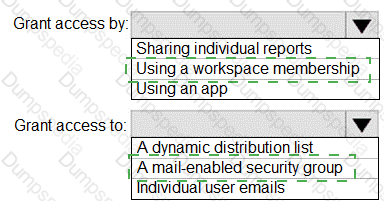
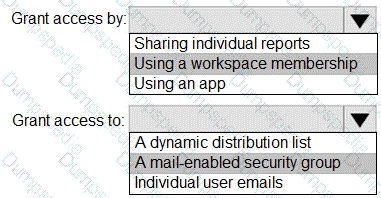
You need to configure access for the sales department users. The solution must me meet the security requirements. What should you do?
Add the sales department as a member of the reports workspace
Add the Azure Active Directory group of the sales department as an Admin of the reports workspace.
Distribute an app to the users in the Azure Active Directory group of the sales department.
Share each report to the Azure Active Directory group of the sales department.
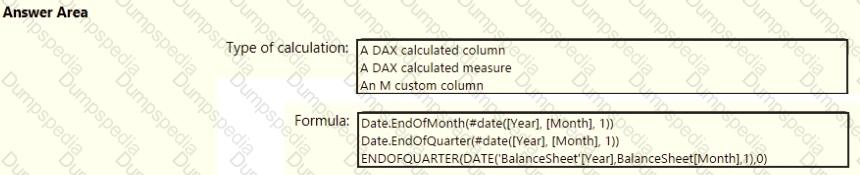
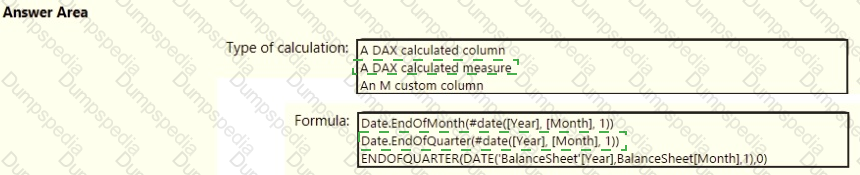
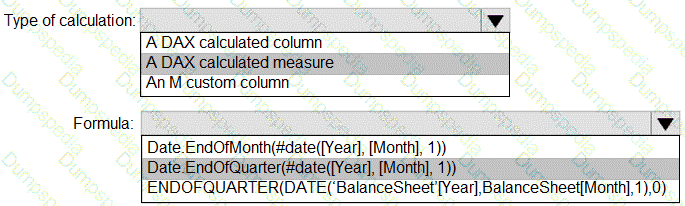
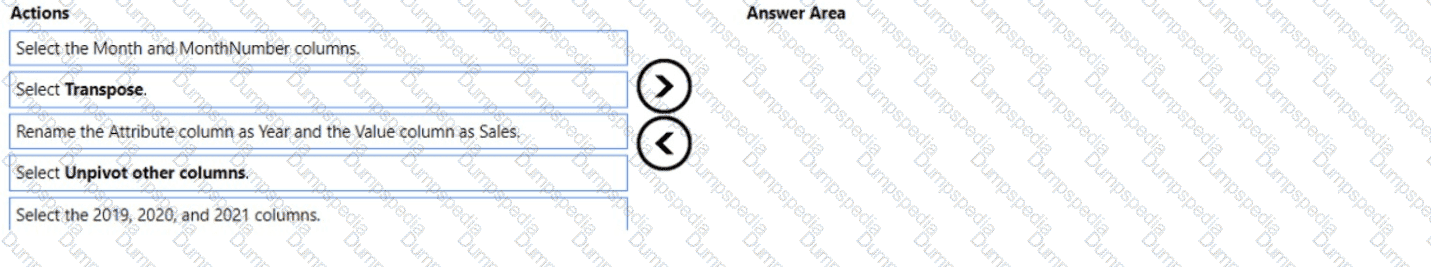
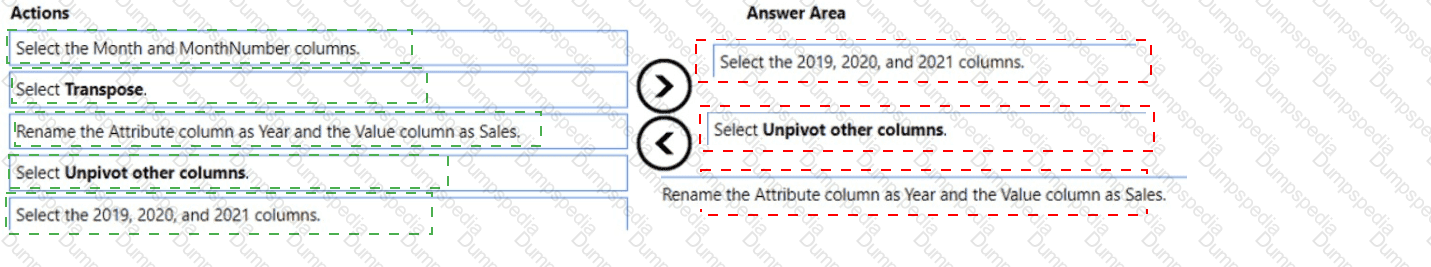
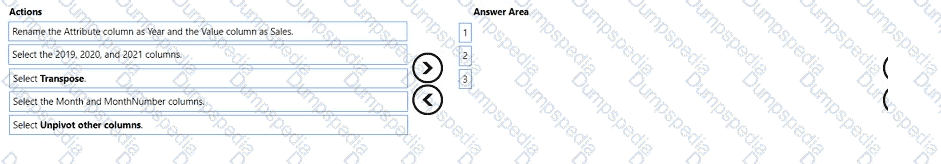
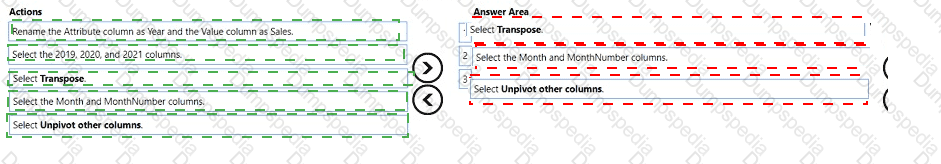
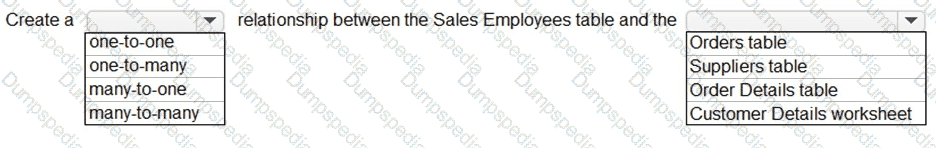
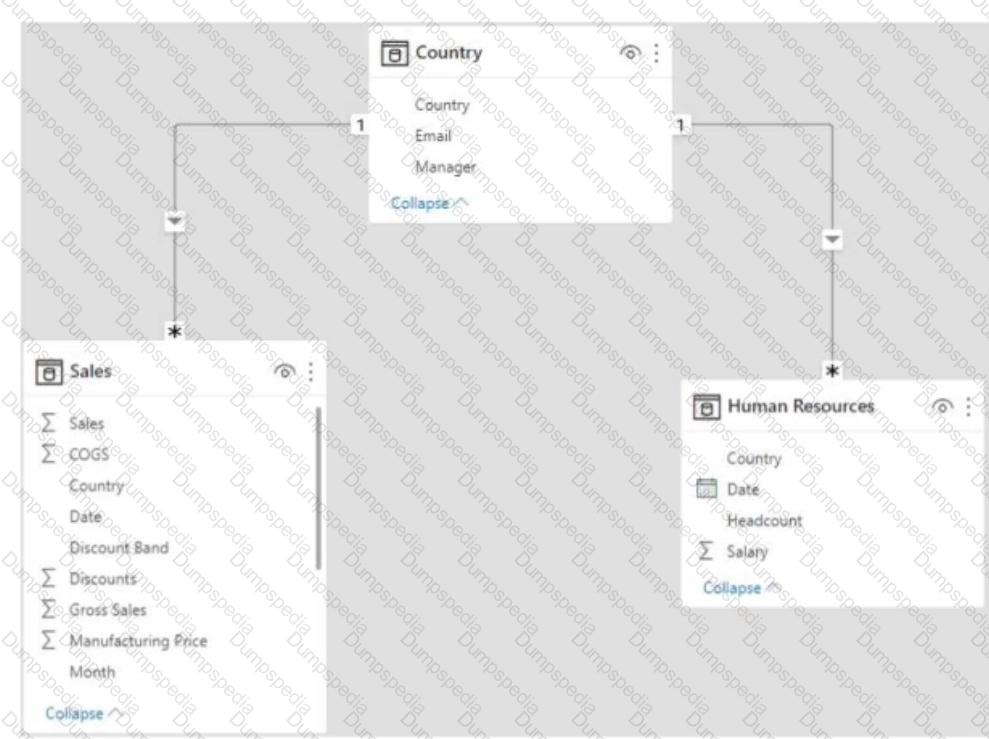
You need to design the data model to meet the report requirements.
What should you do in Power BI Desktop?
From Power Query, use a DAX expression to add columns to the Orders table to calculate the calendar quarter of the OrderDate column, the calendar month of the OrderDate column, the calendar quarter of the ShippedDate column, and the calendar month of the ShippedDate column.
From Power Query, add columns to the Orders table to calculate the calendar quarter and the calendar month of the OrderDate column.
From Power Bl Desktop, use the Auto date/time option when creating the reports.
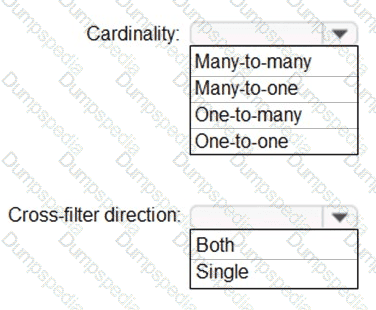
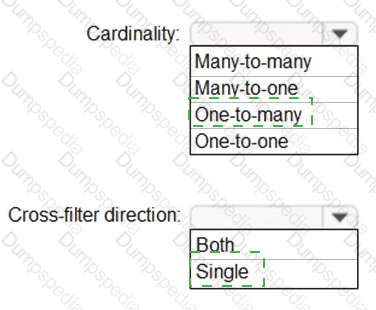
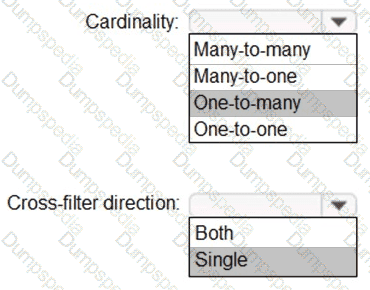
From Power Query, add a date table. Create an active relationship to the OrderDate column in the Orders table and an inactive relationship to the ShippedDate column in the Orders table.
Use Power Query to calculate calendar quarter and calendar month.
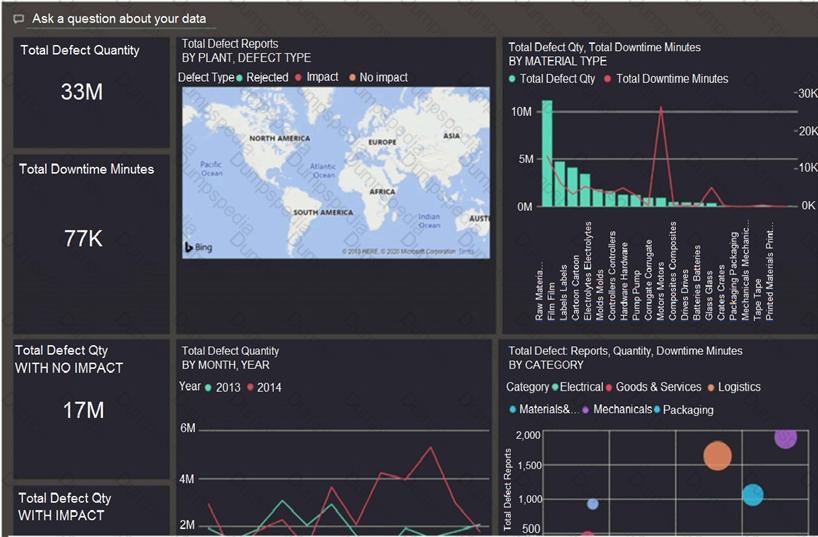
Scenario:
A single dataset must support all three reports:
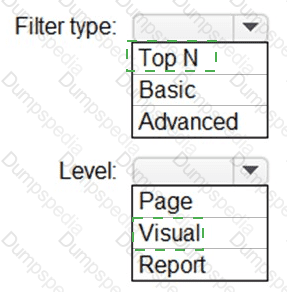
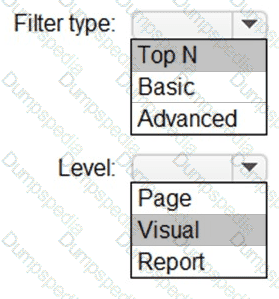
- The Top Customers report will show the top 20 customers based on the highest sales amounts in a selected order month or quarter, product category, and sales region.
- The Top Products report will show the top 20 products based on the highest sales amounts sold in a selected order month or quarter, sales region, and product category.
The data model must minimize the size of the dataset as much as possible, while meeting the report requirements and the technical requirements.
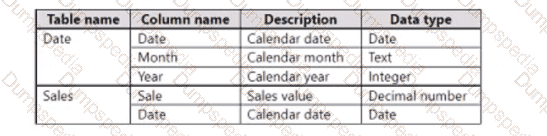
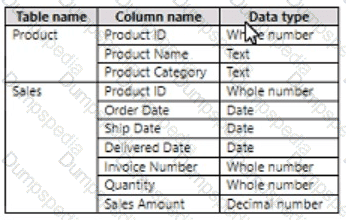
You use Power Query to import two tables named Order Header and Order Details from an Azure SQL database. The Order Header table relates to the Order Details table by using a column named Order ID in each table.
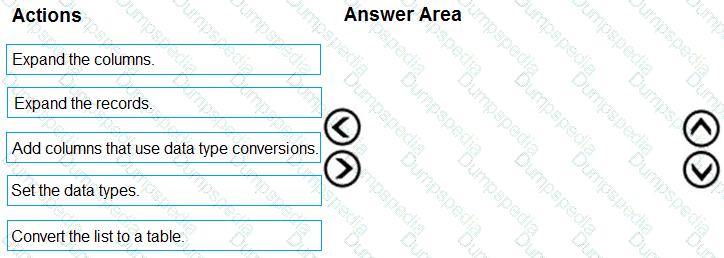
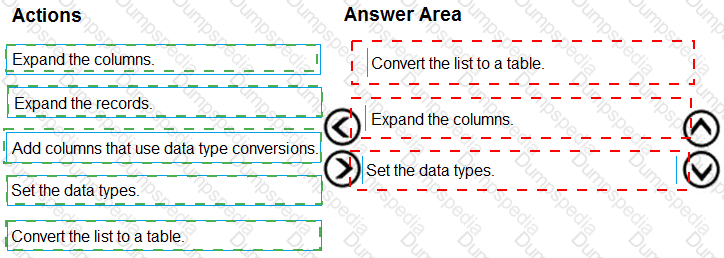
You need to combine the tables into a single query that contains the unique columns of each table.
What should you select in Power Query Editor?
Merge queries
Append queries
Combine files
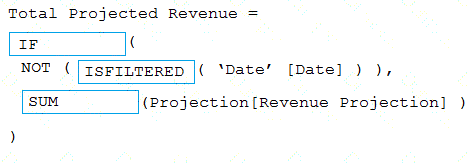
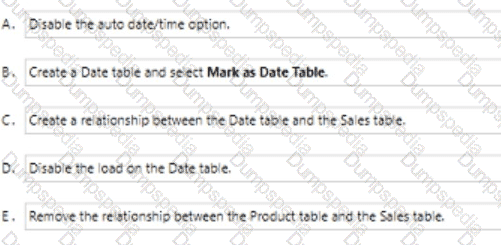
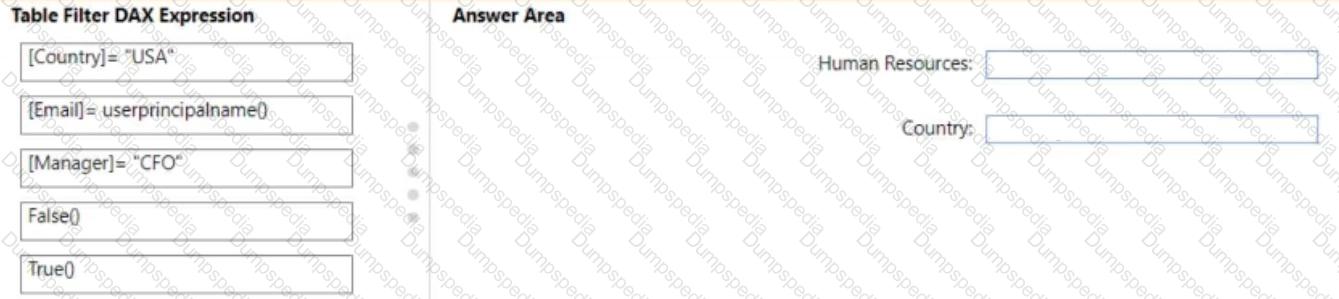
You need to create a measure that will return the percentage of late orders.
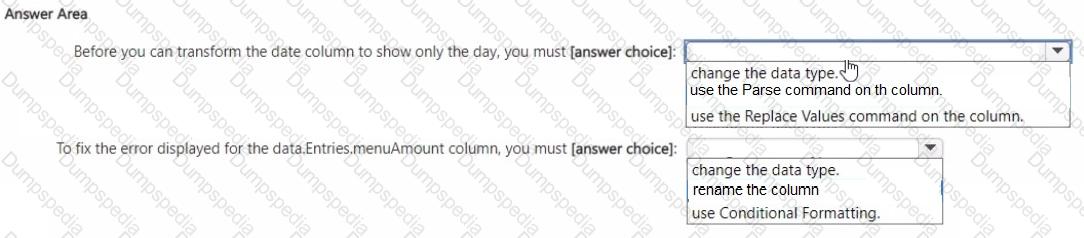
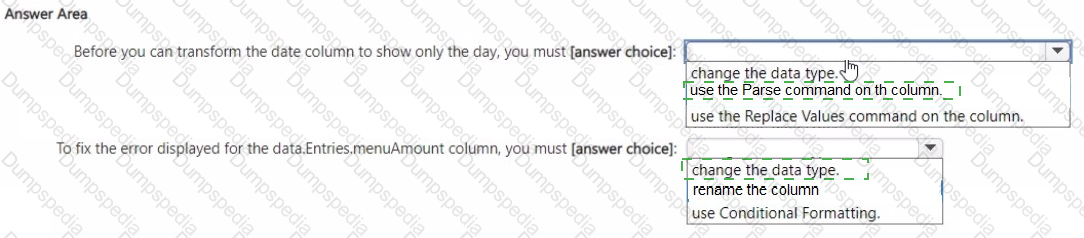
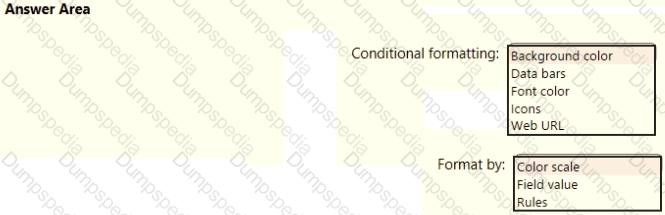
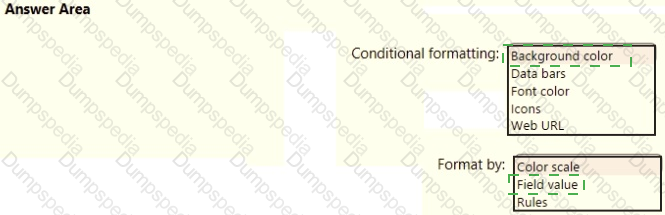
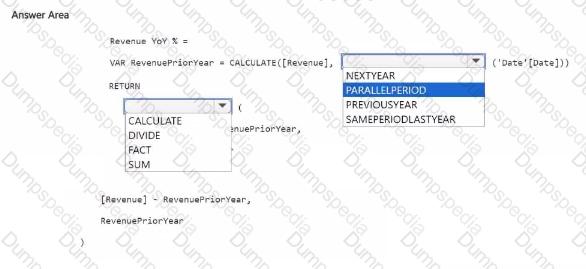
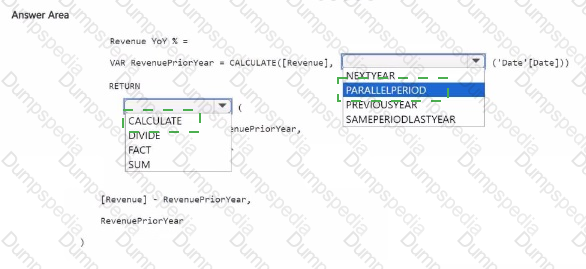
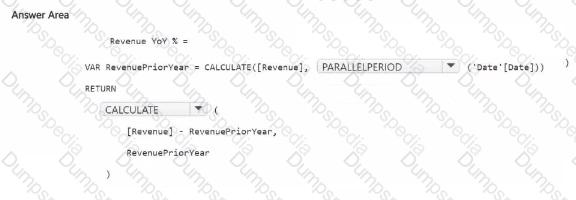
How should you complete the DAX expression? To answer, select the appropriate options in the answer area.
NOTE: Each correct selection is worth one point.
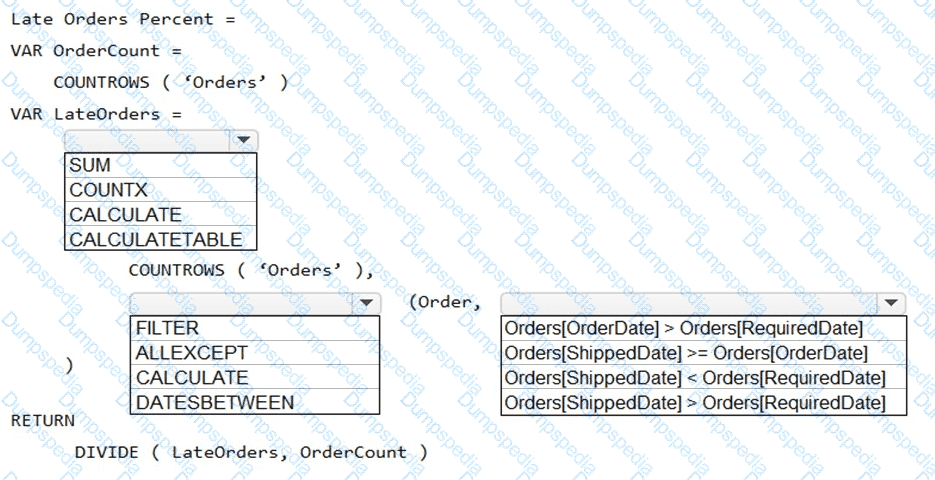
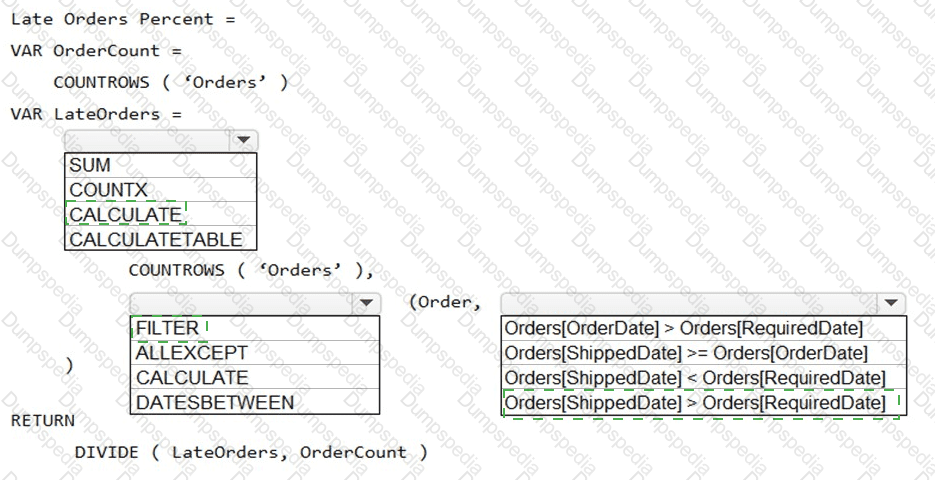
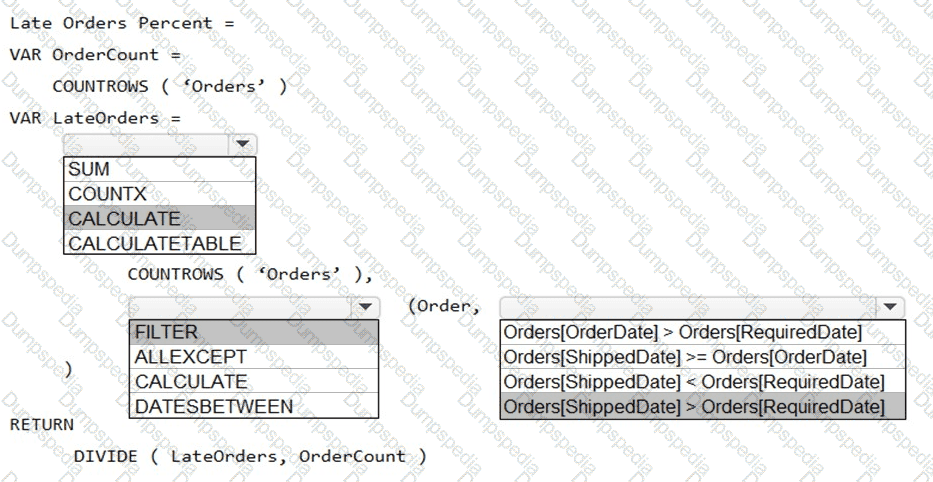
Box 1: CALCULATE
CALCULATE evaluates an expression in a modified filter context.
Syntax: CALCULATE(
Expression - The expression to be evaluated.
filter1, filter2,… (Optional) Boolean expressions or table expressions that defines filters, or filter modifier functions.
Box 2: FILTER
FILTER returns a table that represents a subset of another table or expression.
Syntax: FILTER(
 C:\Users\Waqas Shahid\Desktop\Mudassir\Untitled.jpg