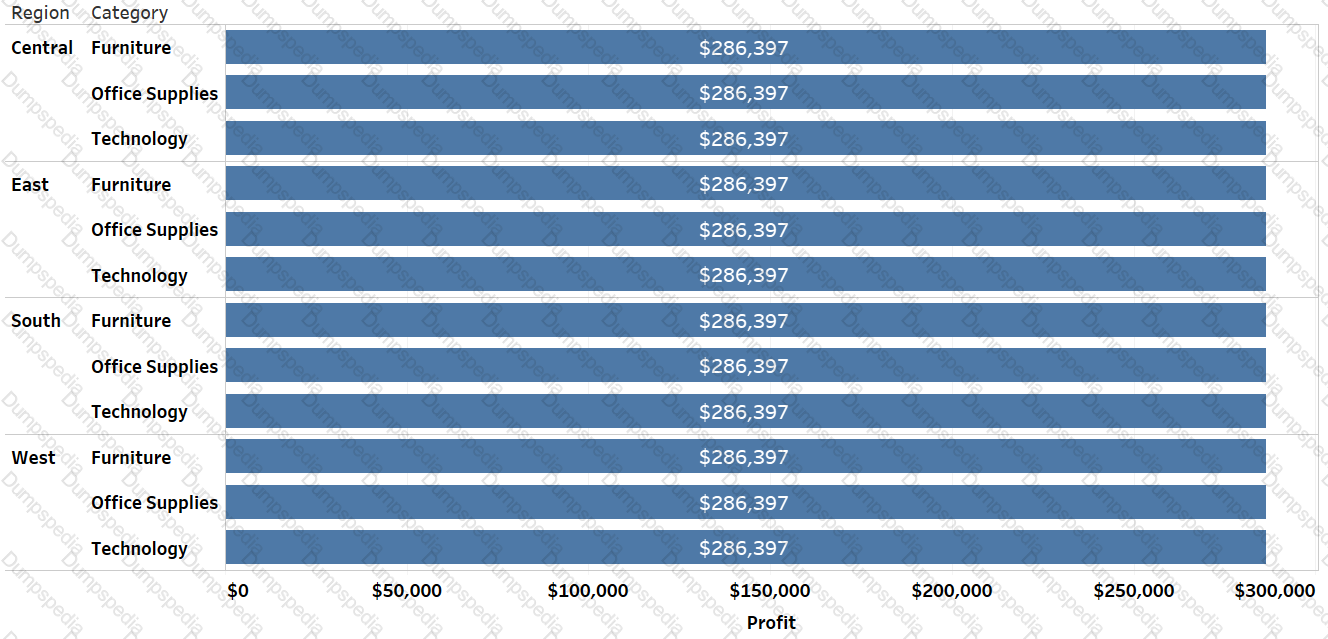
Which of the following are true regarding the data highlighter in Tableau?
You can turn on the highlighter for any field available in your view.
 Table
Description automatically generated
Table
Description automatically generated
If you update the underlying data source for your view the data shown in the highlighter is automatically updated too.
If you have multiple highlighters showing on a dashboard, only one highlighter can be active at a time.
If you want to change the format for the highlighter card after you turn it on, select Format > Highlighter.
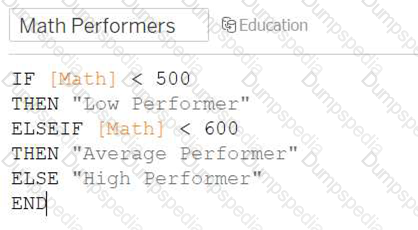
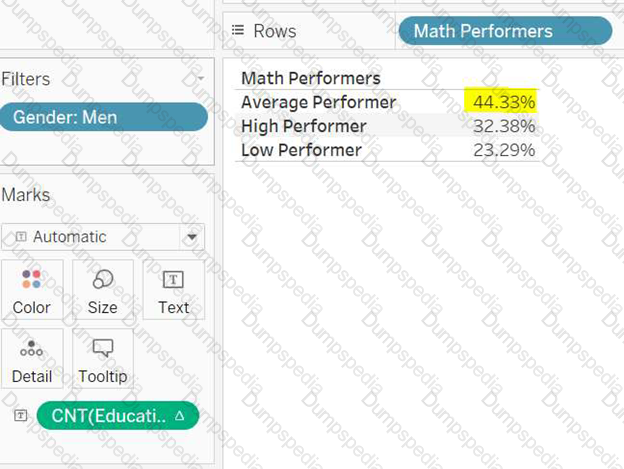
Connect to the "Education" data source. Analyze the Math score and create 3 categories. If the score is less than 500 then consider the student as 'Low Performer'. If the score is greater than or equal to 500 but less than 600 then call it 'Average Performer'. If the score is greater than or equal to 600 then 'High Performer'. Find out the percentage of Average Performers in males?
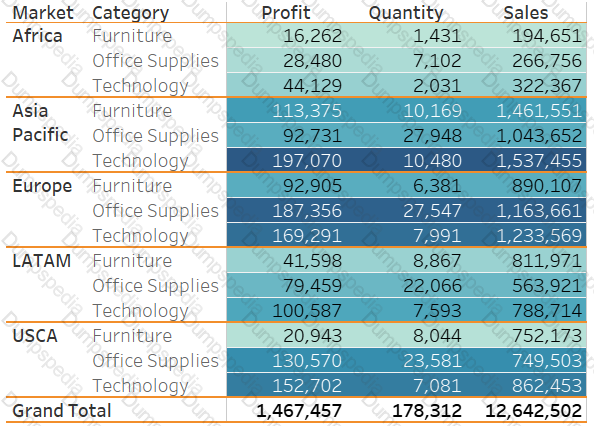
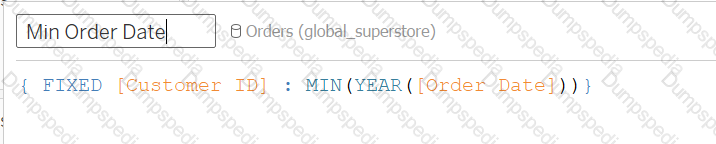
Connect to the "Global Superstore" data source and use the Orders table. Find out the customers who placed their first order in 2013 and what is the total sales value of these customers in the same year?
Connect to the "Global Superstore" data source and use the Orders table. Create a bar in bar chart and compare the profit against the target profit for Canada Region. Consider target profit is 30% of the sales. Which of the following sub-categories has met or exceed the target profit?
In your view, you are using a background image. How can you find the X and Y coordinates on your image?
Connect to the "WorldBank Data" and use the Development Indicators table. Create a relationship between the avg. birth rate and avg. death rate using scatterplot aggregated at the region level, plot death rate on Y-axis and birth rate on X-axis. Add an exponential trendline and find out how many regions are above the trend line?
Connect to the "Flight" data source and find out which carrier was having the highest percentage of delayed flights in 2013?
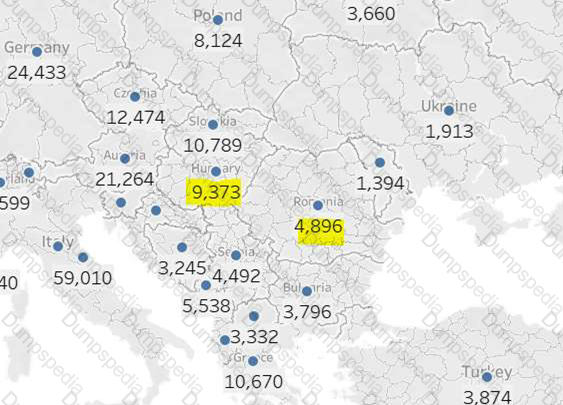
Connect to the "WorldBank Data" and use the Development Indicators table. Create a country map of the Europe and Central Asia region. Find out which neighboring country of Romania is having a greater average GDP per capita than Romania?
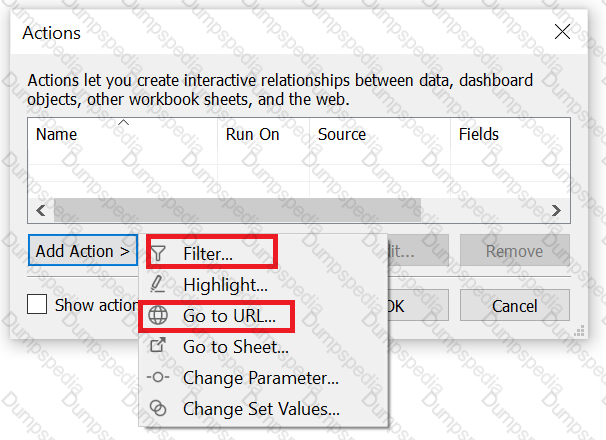
Connect to the "Covid data" source. Create a line chart using continuous months and new deaths. Find the Excess Kurtosis for the sum of new deaths.
To create this view, what all you have to do from the following options?
Larger image

TESTED 16 Jul 2026
 Graphical user interface, text, website
Description automatically generated
Graphical user interface, text, website
Description automatically generated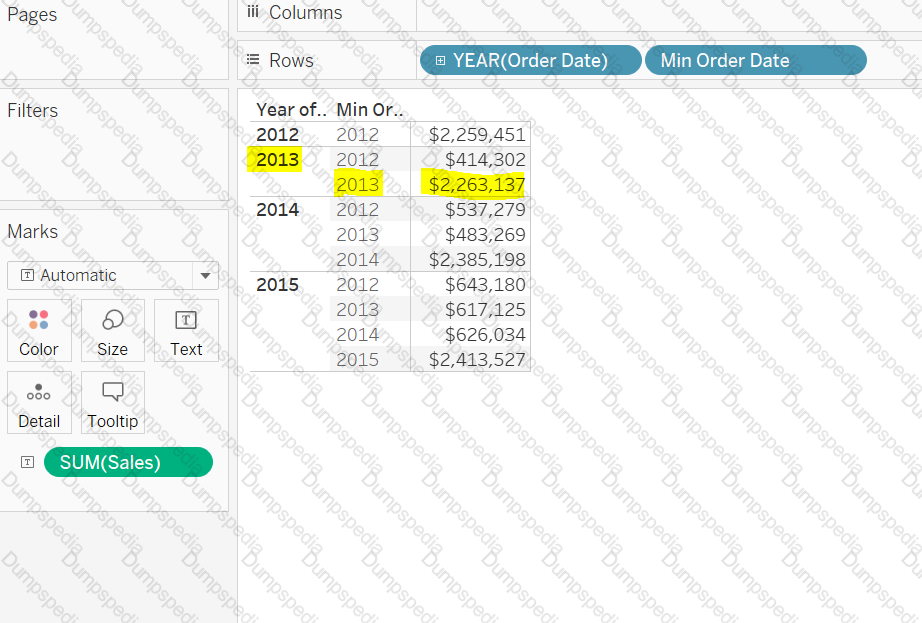 A picture containing graphical user interface
Description automatically generated
A picture containing graphical user interface
Description automatically generated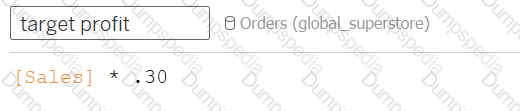 Graphical user interface, application
Description automatically generated
Graphical user interface, application
Description automatically generated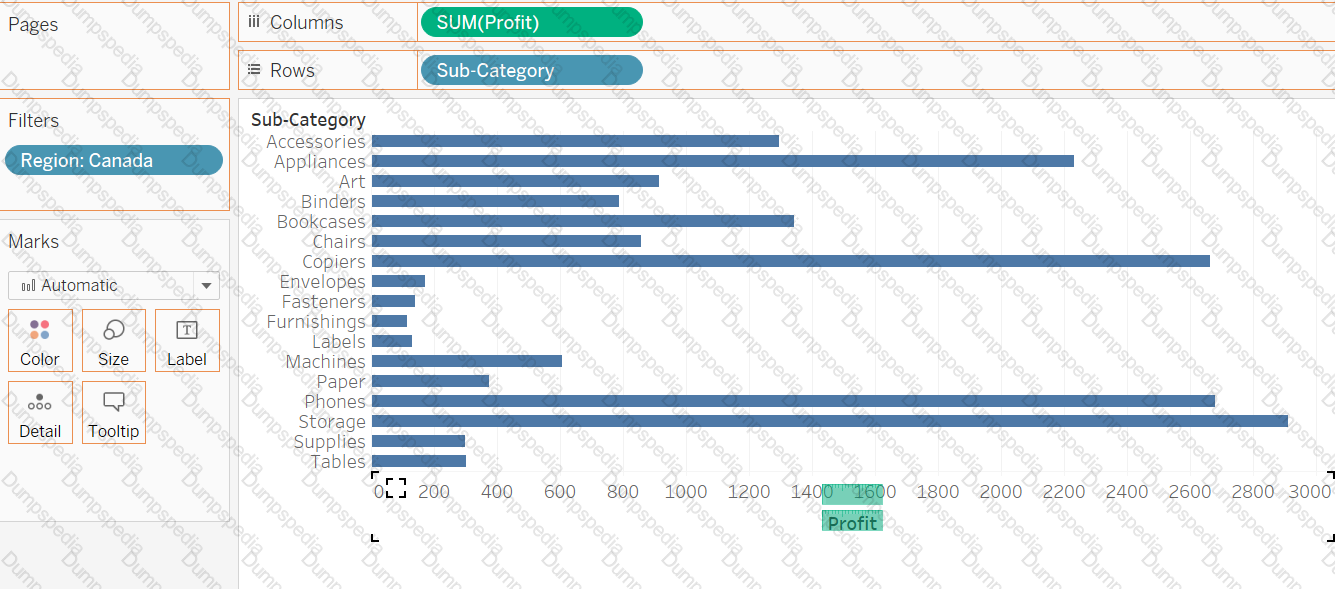 Chart, bar chart
Description automatically generated with medium confidence
Chart, bar chart
Description automatically generated with medium confidence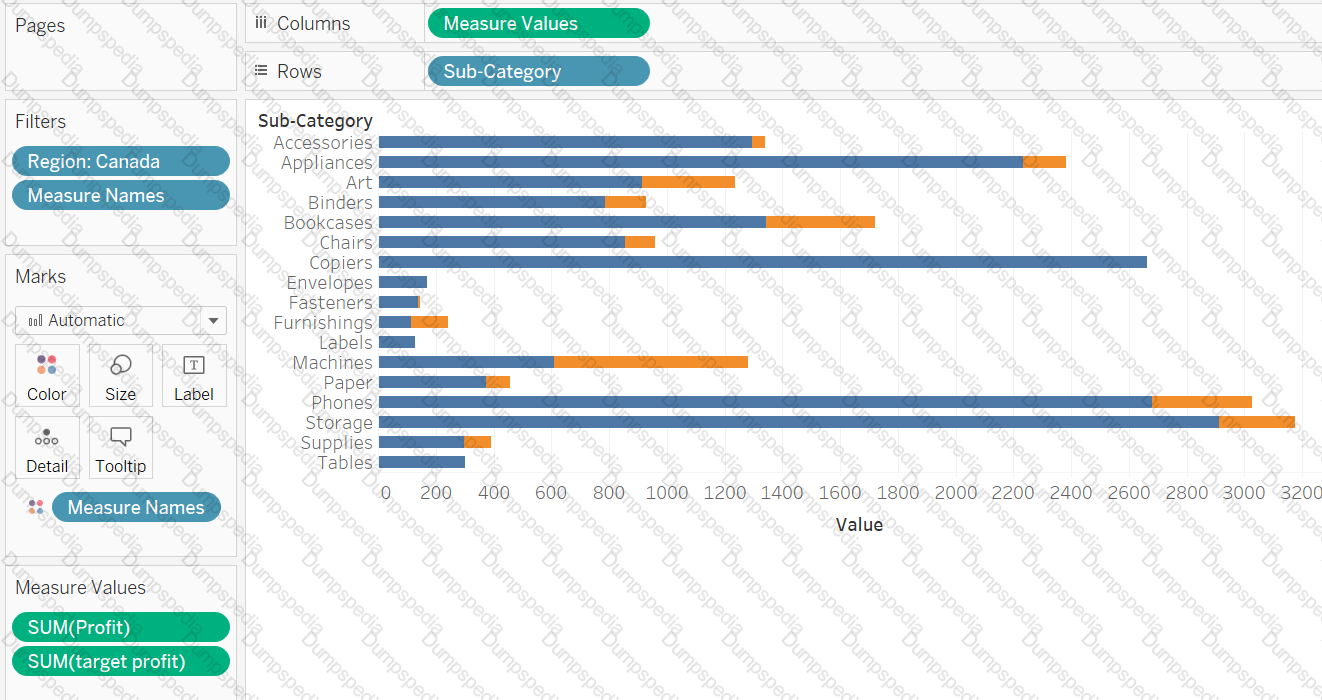 Chart, bar chart
Description automatically generated
Chart, bar chart
Description automatically generated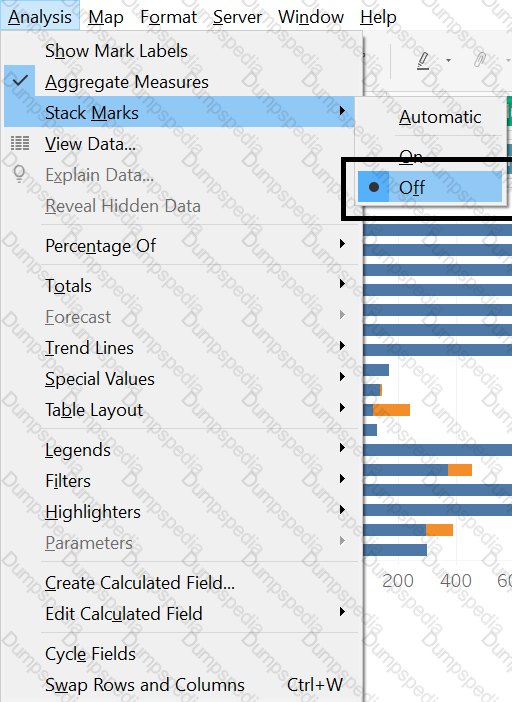 Graphical user interface
Description automatically generated with medium confidence
Graphical user interface
Description automatically generated with medium confidence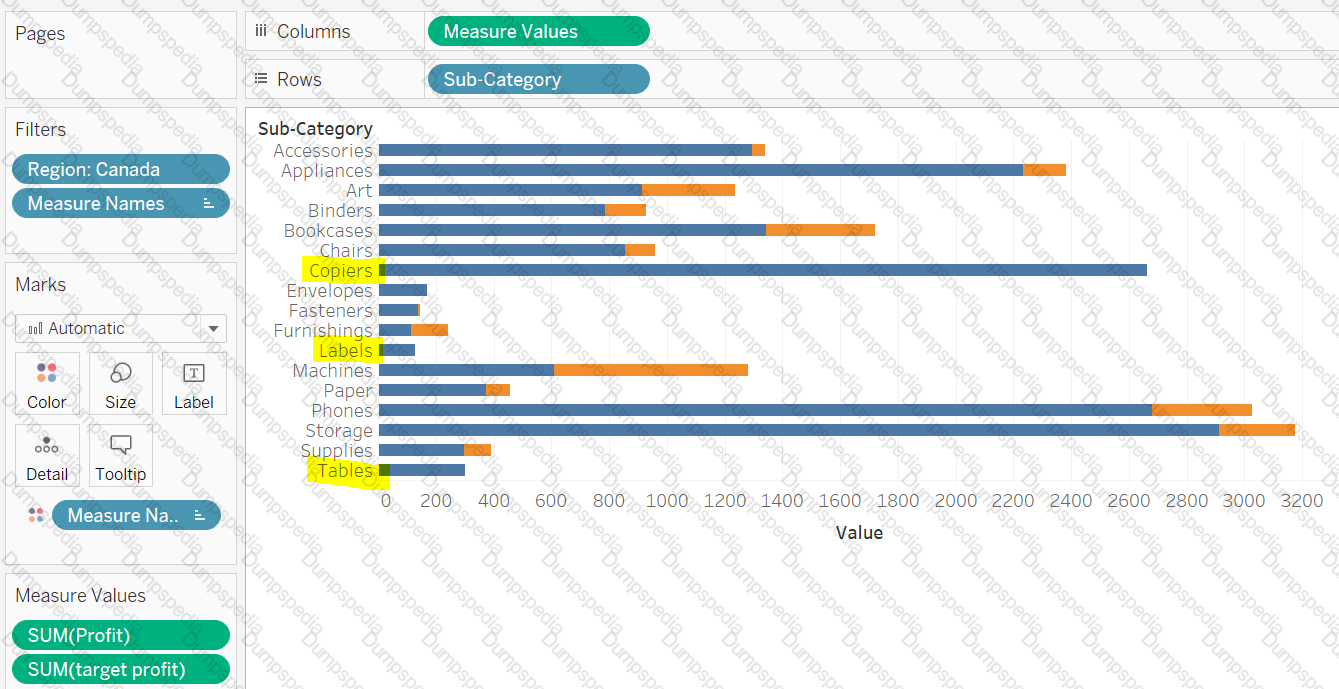 Chart
Description automatically generated
Chart
Description automatically generated


 Graphical user interface
Description automatically generated
Graphical user interface
Description automatically generated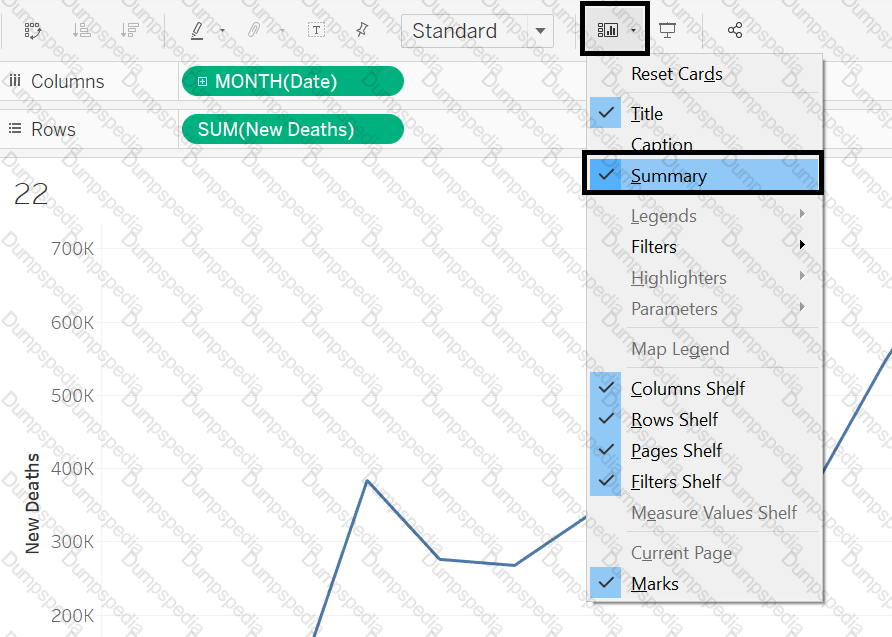 Chart, line chart
Description automatically generated
Chart, line chart
Description automatically generated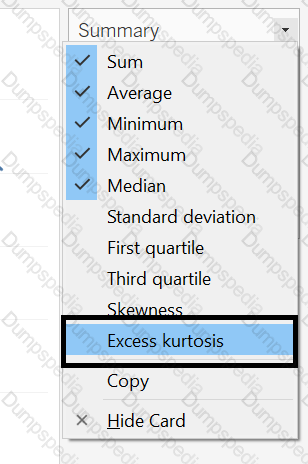 Graphical user interface, application
Description automatically generated
Graphical user interface, application
Description automatically generated