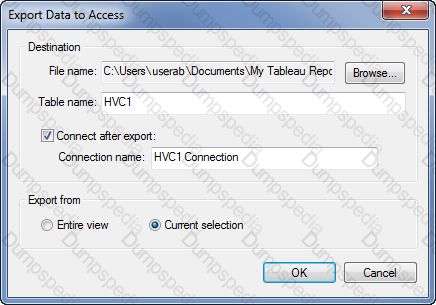
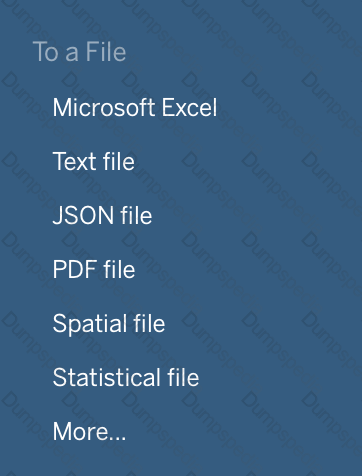
Which of the following are the options to export the data used to build the view / visualisations?
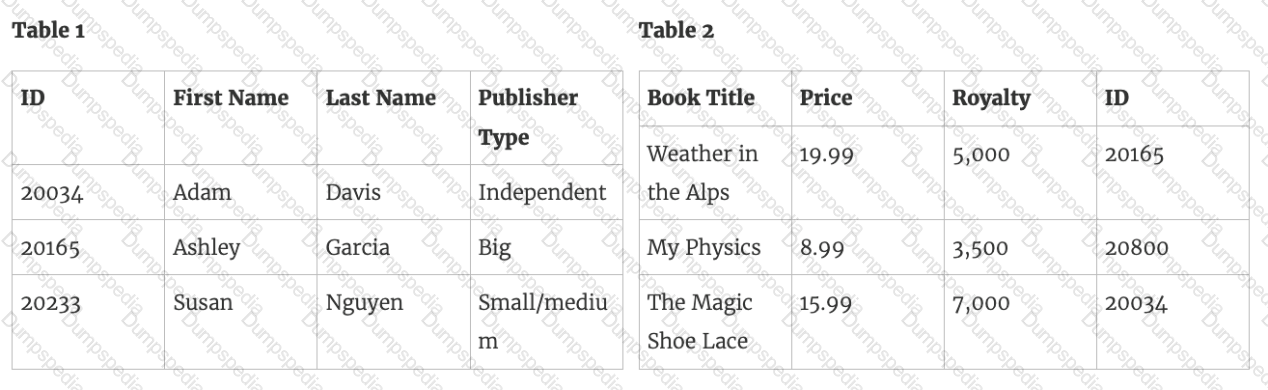
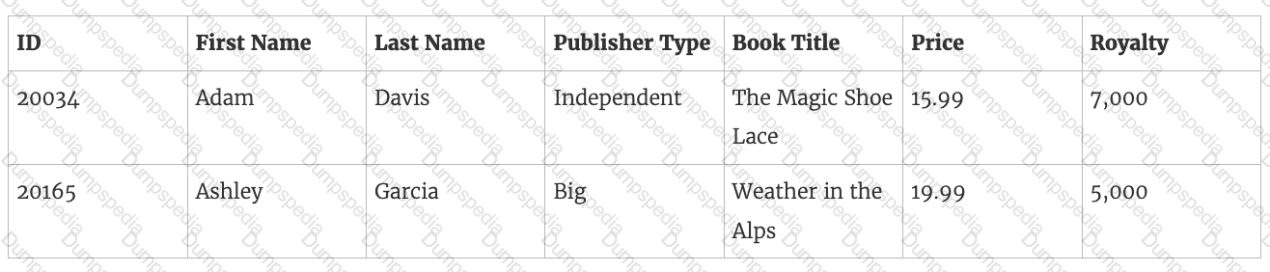
You view the relationship canvas shown in the following exhibit.

What does Migrated Data indicate?
What is created by a calculated field that has a formula of SUM(Sales)/SUM(Profit)?
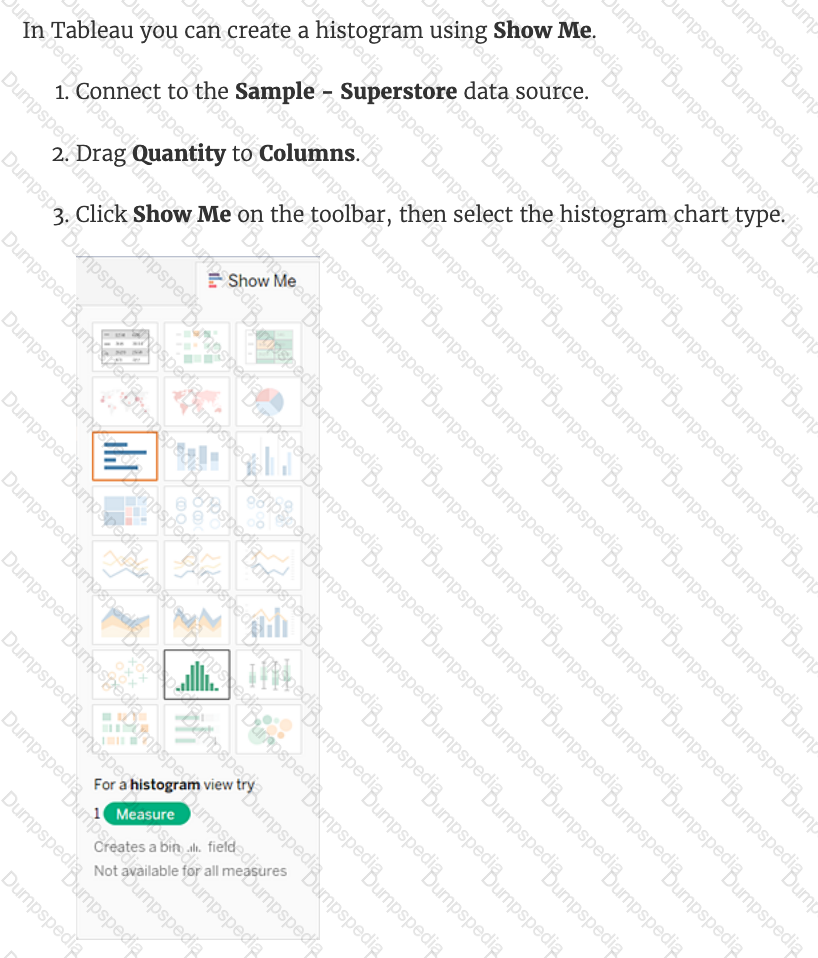
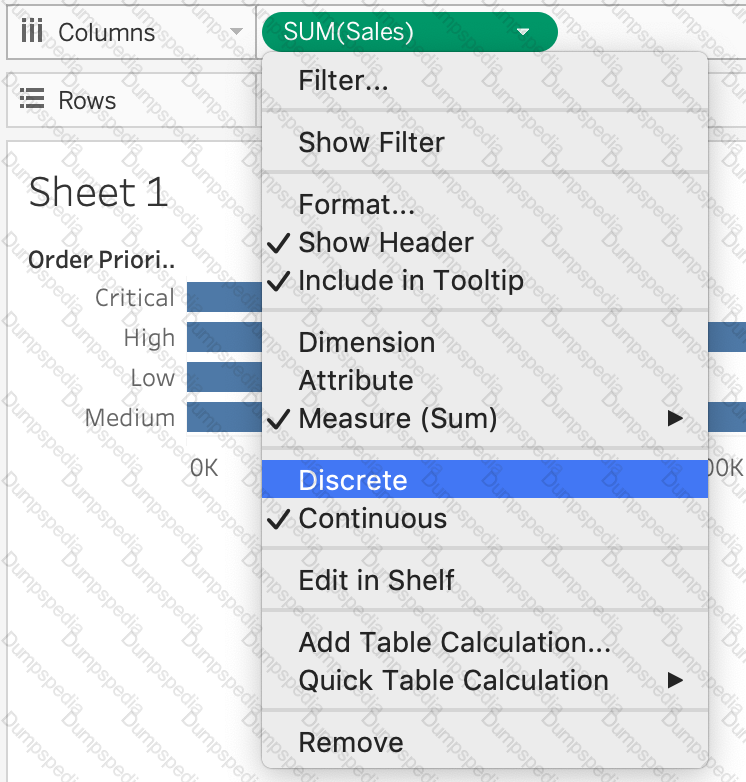
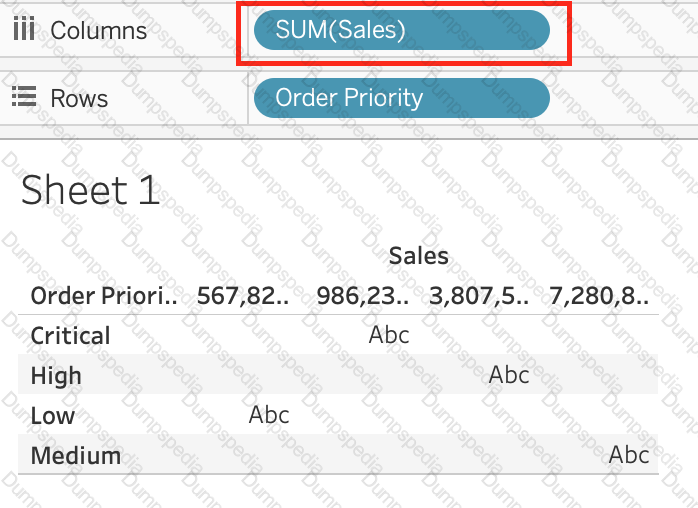
You have a continuous numeric measure named Sales.
Which chart type is created when you double-click the Sales measure?
True or False: A LEFT JOIN or INNER JOIN creates a row each time the join criteria is satisfied, which can result in duplicate rows. One way to avoid this is to use data blending instead.
_________________ are a local copy of a subset or entire data set that you can use to share data with others, when you need to work offline, and improve performance.
You need to access options to change a dimension's color palette.
In addition to the Marks card, what else can you use?
Which of the following is true about 'Incremental refresh' when creating Extracts in Tableau?
When viewing quick table calculations, such as Percent Difference From, that use a value in the previous column, what will be the first data value in the visualization?
When using the manage metadata option, we can create custom names for columns where _____________ is the original name of the column whereas _____________ is the custom name we created in Tableau.
_____________ contains the visualisations, info needed to build the visualisations, and a copy of the data source.
Using the Time Series Table, create a Line chart showing the Monthly Year over Year Growth for the Sales, broken down by Assortment. For the Electronics assortment, which Month had the most NEGATIVE value of Year over Year Growth?
Using the Time Series Table, create a Line chart showing the Monthly Year over Year Growth for the Sales, broken down by Assortment. For the Electronics assortment, which Month had the most NEGATIVE value of Year over Year Growth?
__________ is a technique in Tableau which will identify marks with similar characteristics
Question 45: Skipped
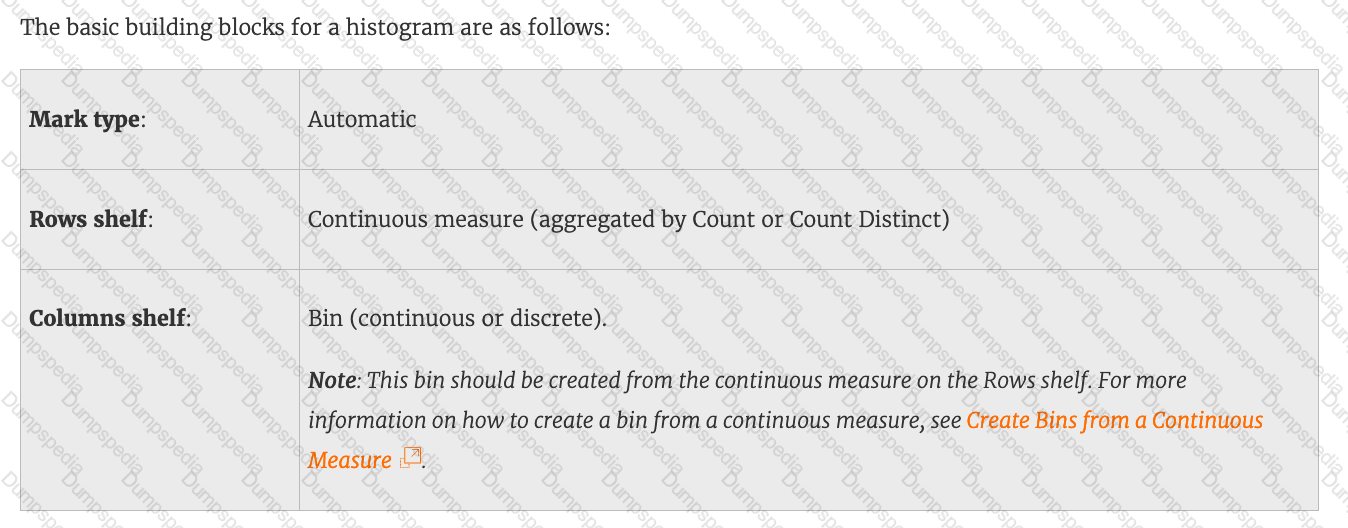
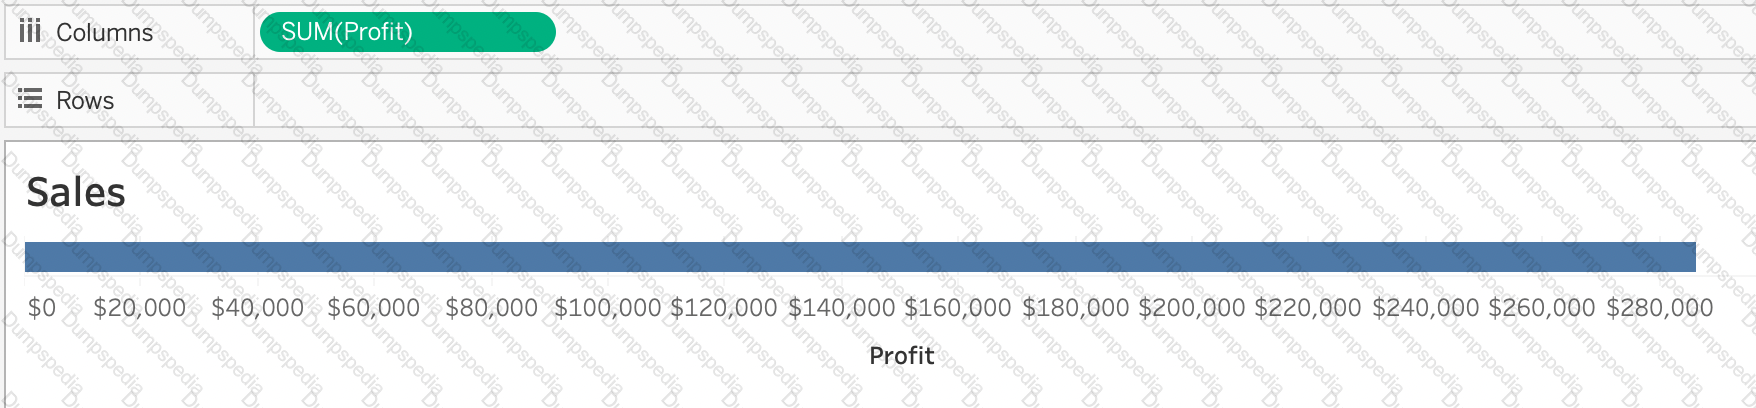
You have just created a histogram and now want to be able to change the size of bins dynamically. Using which of the following will easily satisfy your requirement?
What is the one most important thing you should do after creating a Dual-axis chart?
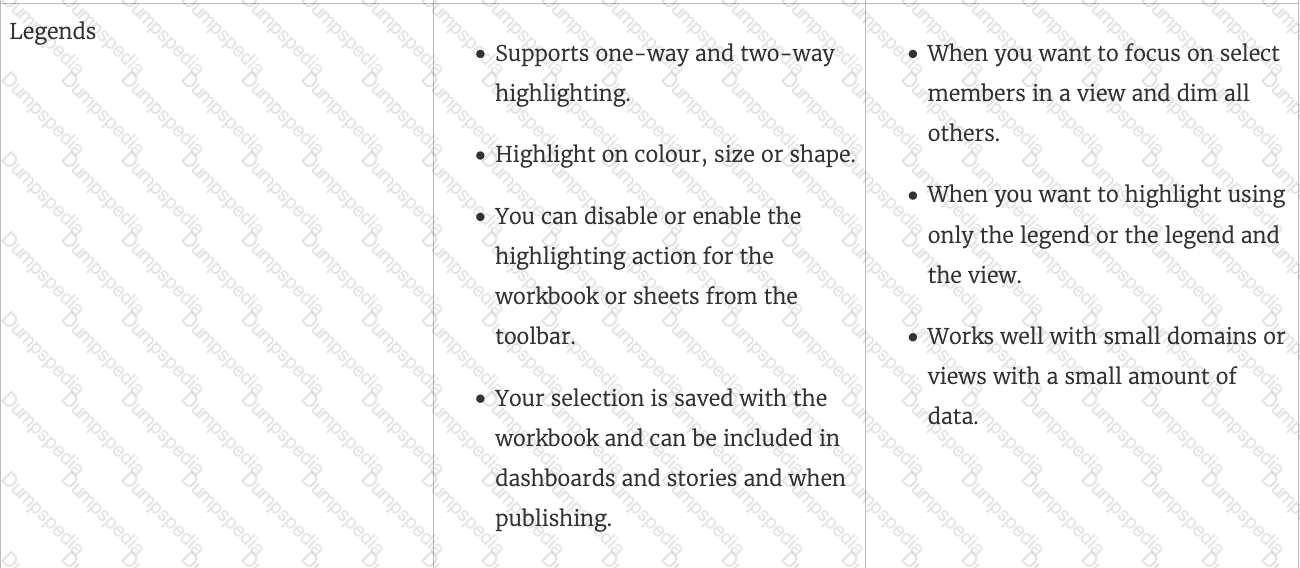
True or False: The Highlighting action can be disabled for the entire workbook.
To display data that has both negative and positive quantitative values, Tableau Desktop will display marks by using__________________as the default.
To customize links based on the data in your dashboard, you can automatically enter field values as _______________ in URLs
Which of the following would you use to connect to multiple tables in a single data source at once?
True or False: Enabling any other type of sort (Field, alphabetic, or Nested) clears the manual sort we create.
Which type of date filter can you use to choose a range of dates based on TODAY ()?
Which of the following URL prefixes are permitted when creating a URL Action in Tableau?
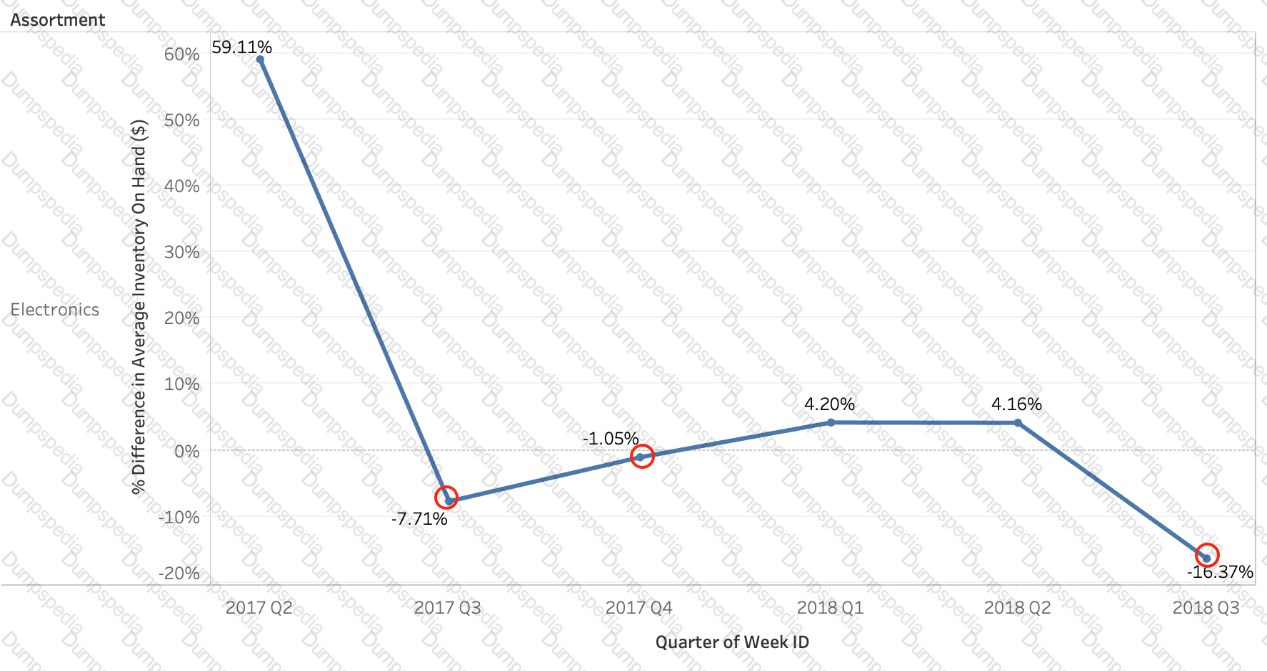
Using the Time Series table, create a chart that shows the percent difference in Average Inventory on Hand for each Assortment by year and quarter.
How many quarters did the Electronics Assortment show a negative percent difference in the Average Inventory On Hand?
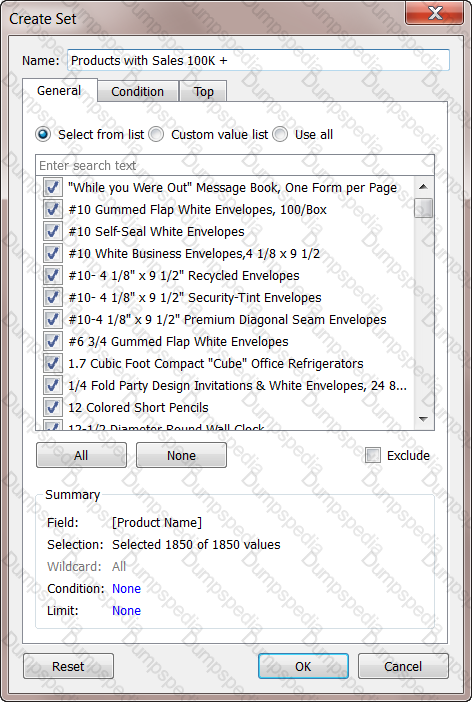
When you want to first apply a filter and THEN show the Top N or Bottom N elements, which of the following filters would you use?
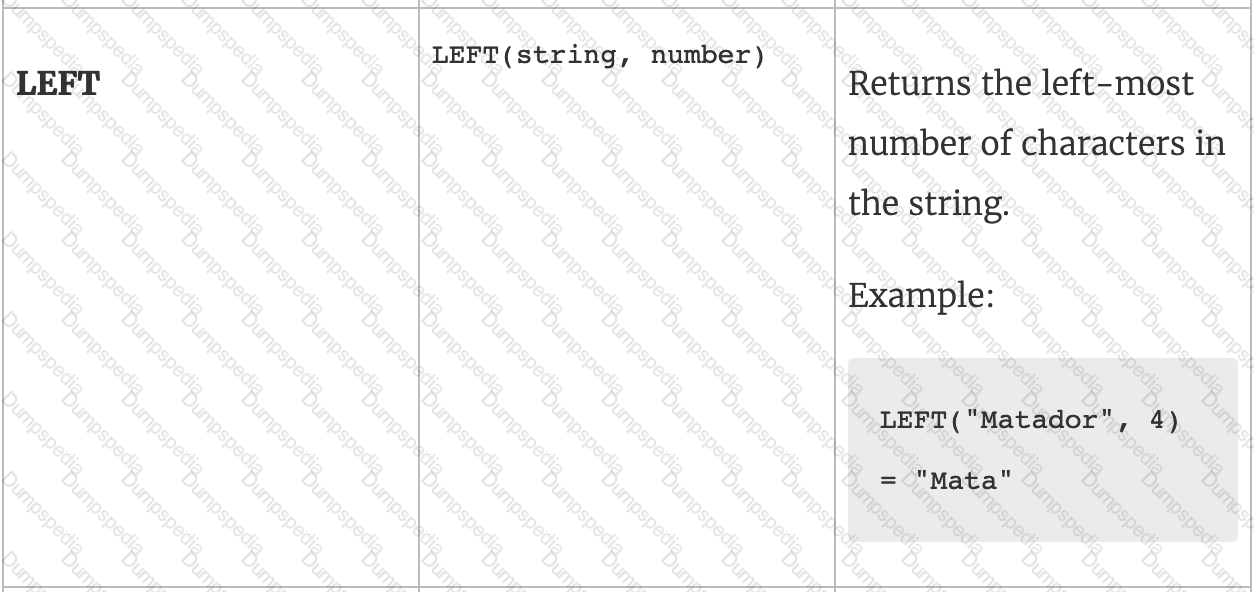
You have the following string value: Sales Data.
Which calculated field produces an output of Sales?
True or False: You get different filtering options for categorical and quantitative data
Given a map, which of the following fields can be placed in Size,Shape,Detail,Color
True or False: Physical tables remain distinct (normalized), not merged in the data source whereas logical tables are merged into a single, flat table.
True or False: When you drag additional tables to the logical layer canvas, Tableau automatically attempts to create the relationship based on existing key constraints and matching fields to define the relationship. If it can't determine the matching fields, then relating these tables is not possible.
When using Animations in a Tableau, which of the following is the default duration for animations?
_________________ is useful when you need to change how the data source is configured on a sheet-by-sheet basis, and when you want to combine databases that don’t allow relationships or joins
When creating an extract, what are three options for specifying how much data to extract? Choose three.
______________ is a method for appending values (rows) to tables. You can use this method if both tables have the same columns. The result is a virtual table that has the same columns but extends vertically by adding rows of data.
_______________ enables us to create workbooks and views, dashboards, and data sources in Tableau Desktop, and then publish this content to our own server.
Which two functionalities can you provide to consumers by adding a parameter to a visualization? Choose two.
Is it possible to use measures in the same view multiple times (e.g. SUM of the measure and AVG of the measure)?
A ________________ is a single zip file that contains a workbook along with any supporting local file data and background images. This format is the best way to package your work for sharing with others who don’t have access to the original data.
Which two actions can you perform when you join tables from multiple connections? Choose two.
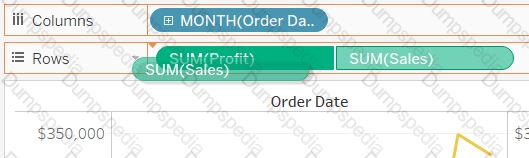
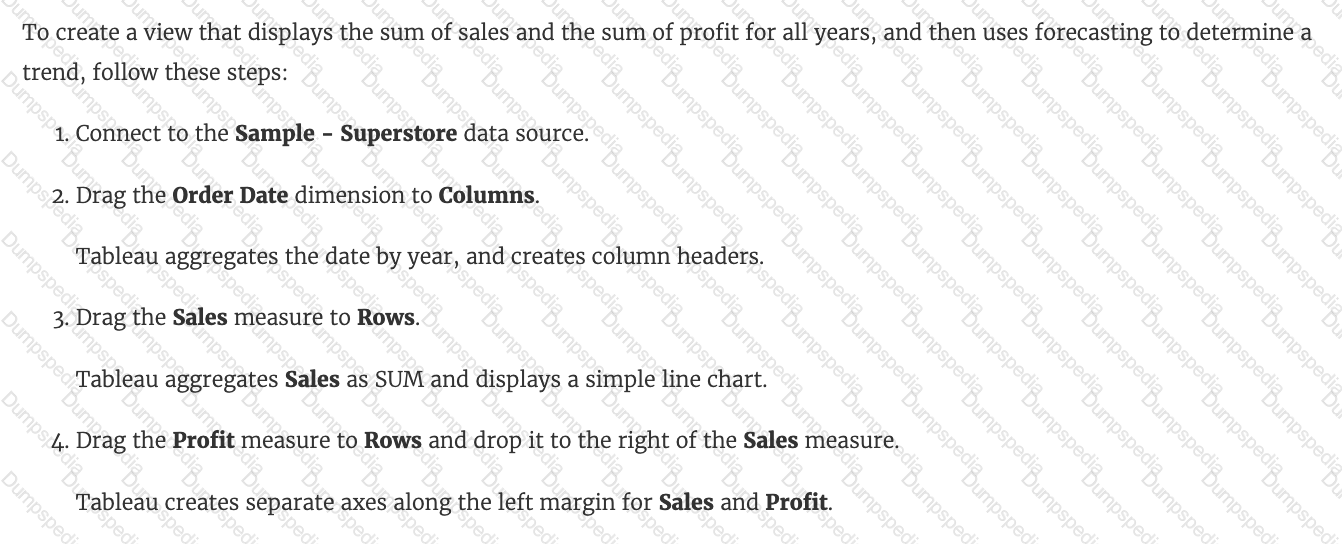
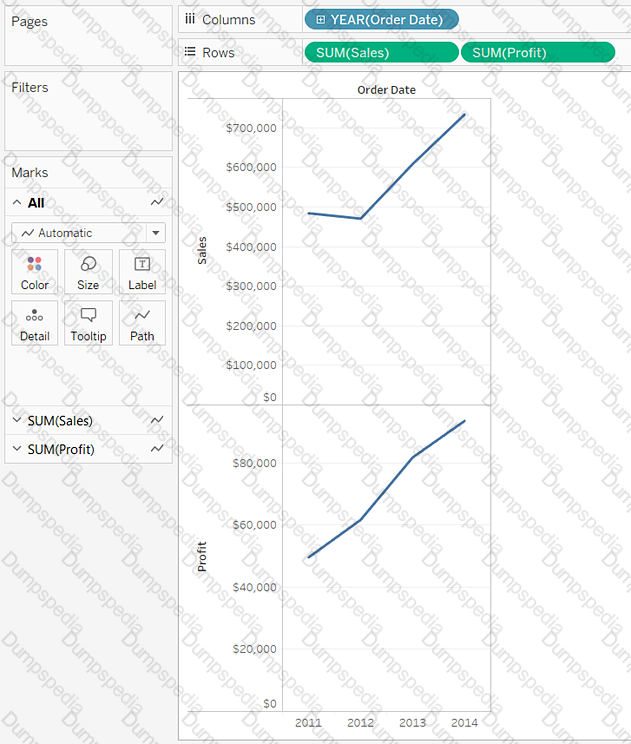
You are creating a combined axis chart.
Where should you drag the second measure after dragging the first measure to the Rows shelf?
Given a map, which of the following fields can be placed on Size,Shape,Detail,Color
Using the CoffeeChain table, create a crosstab showing the Total Expenses per State and add Column Grand Totals to the view. Now group the states of New York, California and Washington. What percent of the total sales does this group contribute?
What are two outcomes when you drag a continuous date value to the Rows shelf? Choose two,
For a ____________ sort, no matter how the data changes, the values will always stay in the sort order we kept stuff in.
You have a data set that builds a union between two tables. You need to extract the data set. What should you use to extract the data set?
Which of the following are valid ways to copy a worksheet visualisation as an image?
If you use a percent difference Quick Table Calculation, what value will be the first data value?
True or False: A sheet cannot be used within a story directly. Either sheets should be used within a dashboard, or a dashboard should be used within a story.
The default path for all supporting files, data sources, icons, logs etc is in ______________________
Which of the following are correct ways to define a join in Tableau version 2020.3 and above?
______________ refers to the level of detail for a piece of data, wherever you are looking.
When exporting a worksheet as an image in Tableau, which of the following file formats are available?
You create the following visualization.
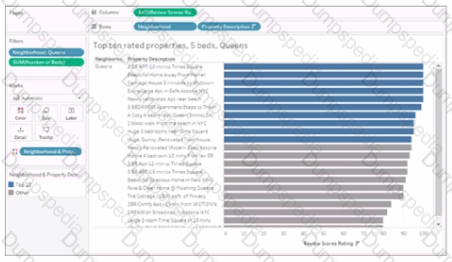
What is the first step to create the visual grouping of the 10 marks shown in blue?
You have a workbook that contains one data source and you need to combine data from another database. What should you do first?
Which of the following lets you group related dashboard items together so you can quickly position them?

TESTED 16 Jul 2026

 Graphical user interface, text, application, email
Description automatically generated
Graphical user interface, text, application, email
Description automatically generated Graphical user interface, text, application
Description automatically generated
Graphical user interface, text, application
Description automatically generated


 Text
Description automatically generated
Text
Description automatically generated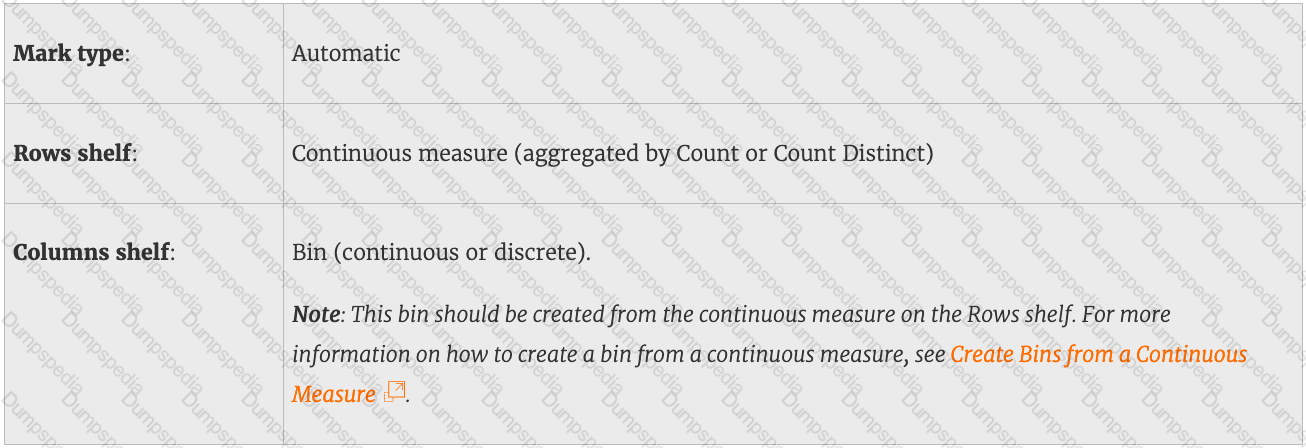

 Graphical user interface, text, application
Description automatically generated
Graphical user interface, text, application
Description automatically generated Graphical user interface, application, Word
Description automatically generated
Graphical user interface, application, Word
Description automatically generated Graphical user interface, text, application
Description automatically generated
Graphical user interface, text, application
Description automatically generated Graphical user interface, text, application
Description automatically generated
Graphical user interface, text, application
Description automatically generated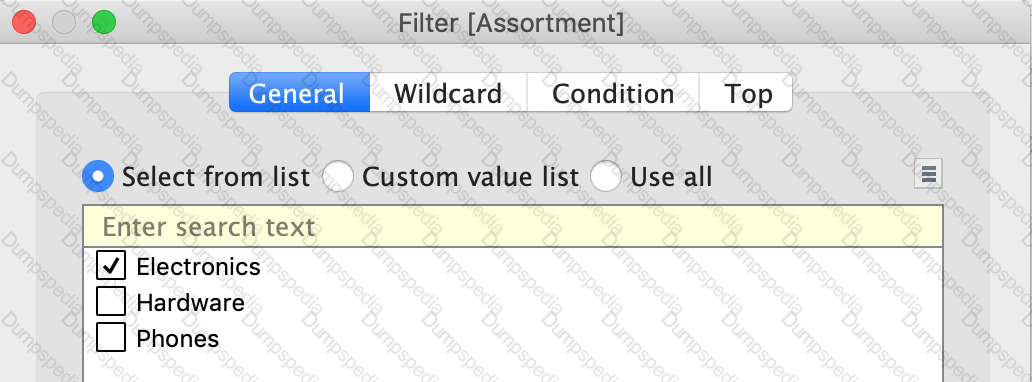


 Graphical user interface, application
Description automatically generated
Graphical user interface, application
Description automatically generated


 Graphical user interface, text, application, email, Teams
Description automatically generated
Graphical user interface, text, application, email, Teams
Description automatically generated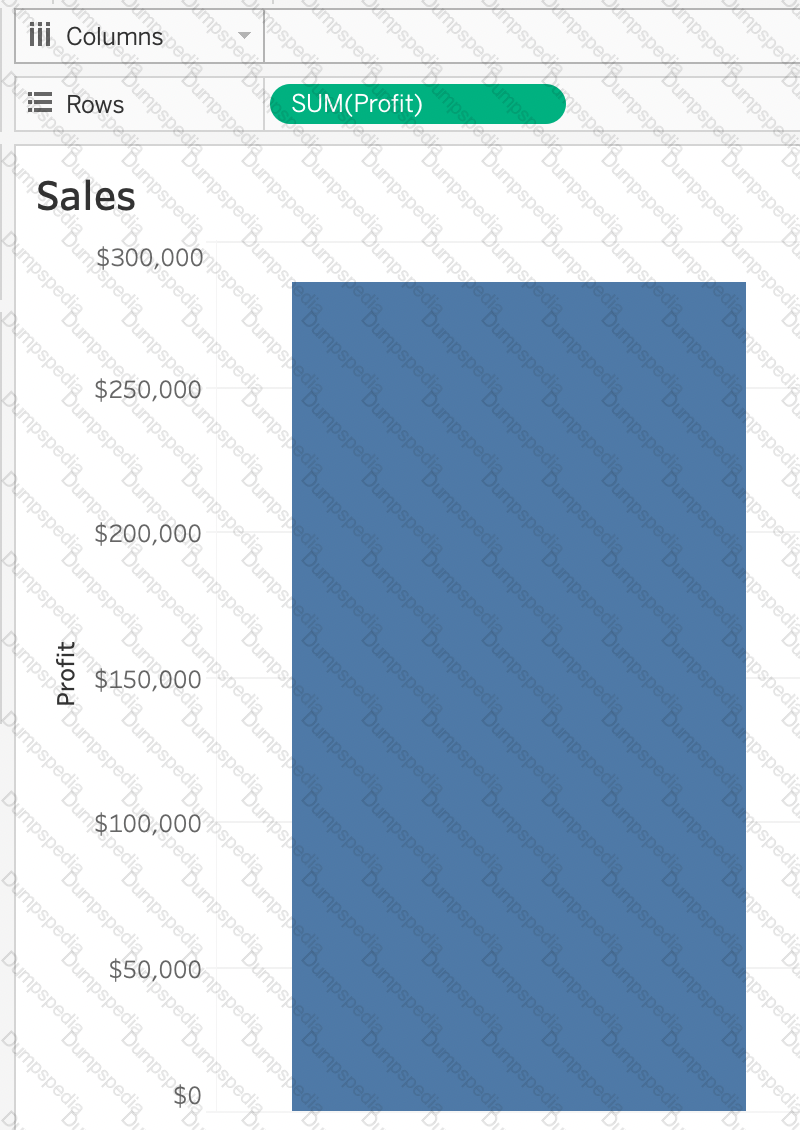 Graphical user interface
Description automatically generated with low confidence
Graphical user interface
Description automatically generated with low confidence Graphical user interface
Description automatically generated
Graphical user interface
Description automatically generated Graphical user interface, application, Word
Description automatically generated
Graphical user interface, application, Word
Description automatically generated Graphical user interface, application
Description automatically generated
Graphical user interface, application
Description automatically generated Graphical user interface, application, Word
Description automatically generated
Graphical user interface, application, Word
Description automatically generated A picture containing line chart
Description automatically generated
A picture containing line chart
Description automatically generated Graphical user interface
Description automatically generated
Graphical user interface
Description automatically generated


 Chart, line chart
Description automatically generated
Chart, line chart
Description automatically generated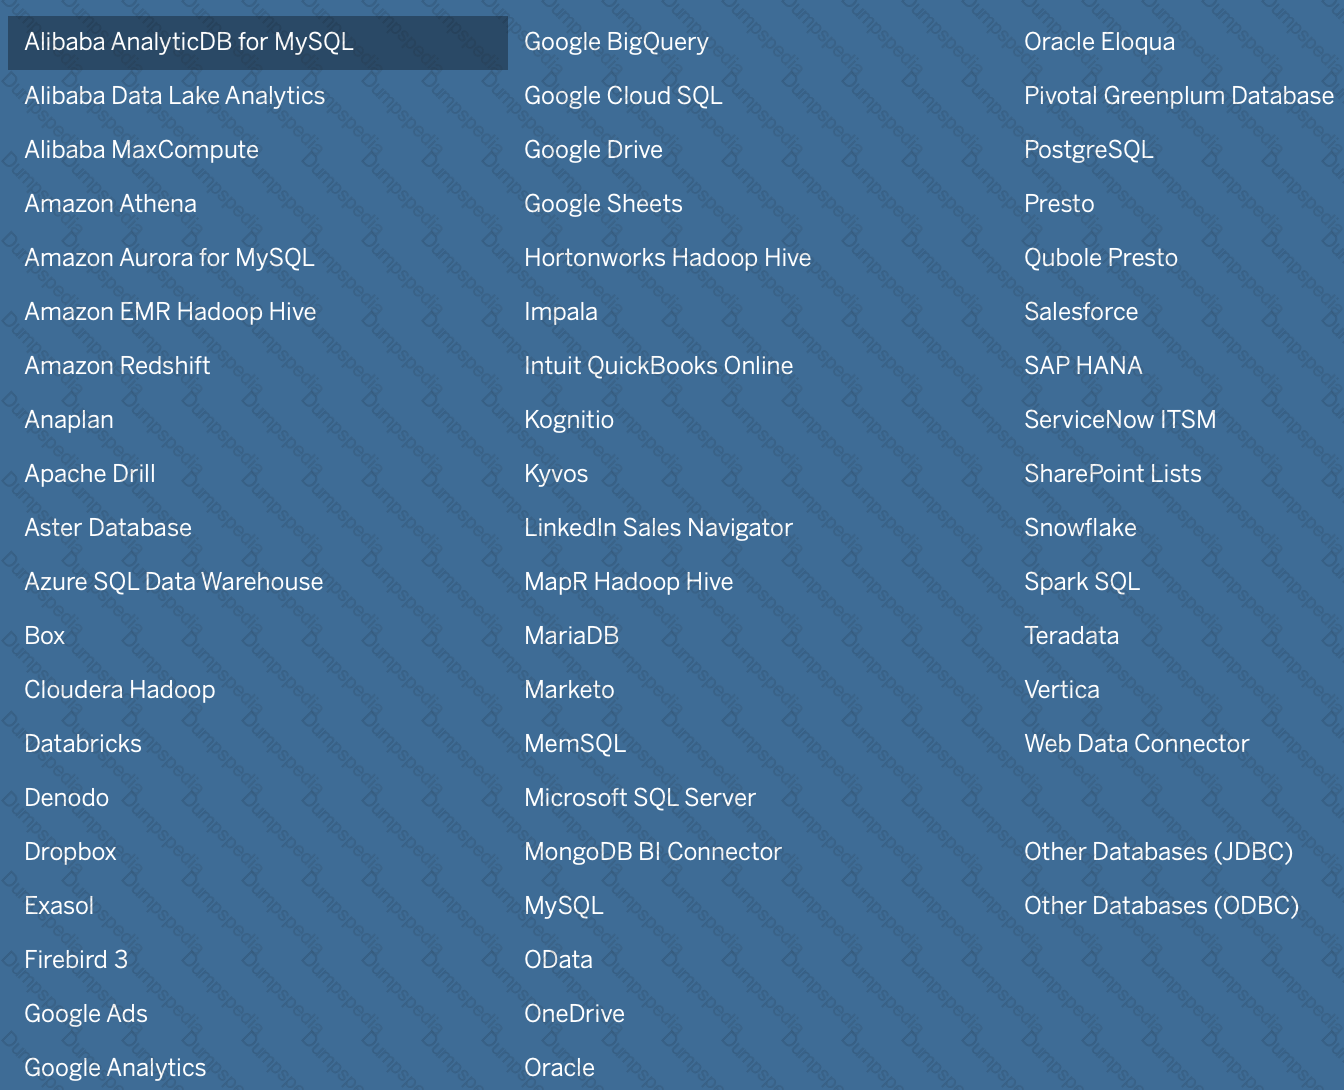


 ( Simple Scatter Plot)
 (Matrix of Scatter Plots)