Exhibit:
Which observation about this FortiAnalyzer Fabric deployment architecture is true?
The AMER HQ SOC team cannot run automation playbooks from the Fabric supervisor.
The AMER HQ SOC team must configure high availability (HA) for the supervisor node.
The EMEA SOC team has access to historical logs only.
The APAC SOC team has access to FortiView and other reporting functions.
Understanding FortiAnalyzer Fabric Deployment:
FortiAnalyzer Fabric deployment involves a hierarchical structure where the Fabric root (supervisor) coordinates with multiple Fabric members (collectors and analyzers).
This setup ensures centralized log collection, analysis, and incident response across geographically distributed locations.
Analyzing the Exhibit:
FAZ1-Supervisoris located at AMER HQ and acts as the Fabric root.
FAZ2-Analyzeris a Fabric member located in EMEA.
FAZ3-CollectorandFAZ4-Collectorare Fabric members located in EMEA and APAC, respectively.
Evaluating the Options:
Option A:The statement indicates that the AMER HQ SOC team cannot run automation playbooks from the Fabric supervisor. This is true because automation playbooks and certain orchestration tasks typically require local execution capabilities which may not be fully supported on the supervisor node.
Option B:High availability (HA) configuration for the supervisor node is a best practice for redundancy but is not directly inferred from the given architecture.
Option C:The EMEA SOC team having access to historical logs only is not correct since FAZ2-Analyzer provides full analysis capabilities.
Option D:The APAC SOC team has access to FortiView and other reporting functions through FAZ4-Collector, but this is not explicitly detailed in the provided architecture.
Conclusion:
The most accurate observation about this FortiAnalyzer Fabric deployment architecture is that the AMER HQ SOC team cannot run automation playbooks from the Fabric supervisor.
Refer to the exhibit.
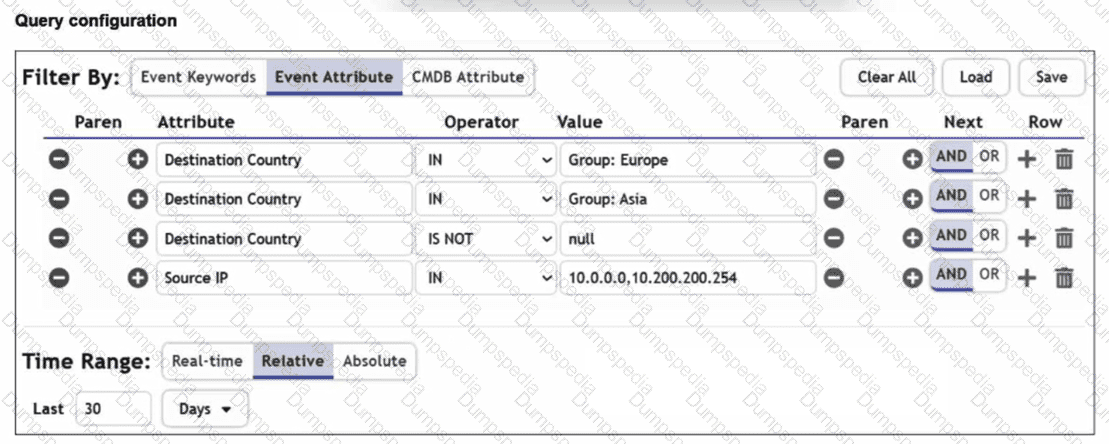
You are trying to find traffic flows to destinations that are in Europe or Asia, for hosts in the local LAN segment. However, the query returns no results. Assume these logs exist on FortiSIEM.
Which three mistakes can you see in the query shown in the exhibit? (Choose three answers)
The null value cannot be used with the IS NOT operator.
The time range must be Absolute for queries that use configuration management database (CMDB) groups.
There are missing parentheses between the first row (Group: Europe) and the second row (Group: Asia).
The Source IP row operator must be BETWEEN 10.0.0.0, 10.200.200.254.
The logical operator for the first row (Group: Europe) must be OR.
Comprehensive and Detailed Explanation From FortiSOAR 7.6., FortiSIEM 7.3 Exact Extract study guide:
Analyzing theQuery Configurationexhibit in the context of FortiSIEM 7.3 search logic reveals several syntax and logical errors that prevent the query from returning results:
Logical Operator Error (E):The user intends to find traffic to EuropeORAsia. In the exhibit, the first row (Group: Europe) is followed by a defaultANDoperator. This forces the query to look for a single flow where the destination is simultaneously in Europe and Asia, which is logically impossible. It must be changed toOR.
Missing Parentheses (C):When combiningORandANDlogic in FortiSIEM, parentheses are required to define the order of operations. Without them, the query might evaluate "Asia AND Destination Country IS NOT null AND Source IP IN..." first. To correctly find (Europe OR Asia) that also matches the LAN segment, parentheses must group the first two rows.
Incorrect Operator for IP Range (D):The exhibit uses theINoperator for the value 10.0.0.0, 10.200.200.254. In FortiSIEM, theINoperator is used for a comma-separated list of specific values or CMDB groups. To specify a continuous range of IP addresses (the "LAN segment"), theBETWEENoperator must be used.
Why other options are incorrect:
IS NOT null (A):In FortiSIEM, "IS NOT null" is a valid operator/value combination used to ensure a specific attribute has been successfully parsed and populated in the event record.
Time Range (B):There is no requirement for a time range to be "Absolute" when using CMDB groups; "Relative" time ranges (like the "Last 30 Days" shown) are commonly used and fully supported for such queries.
SOC Concepts and Frameworks
Which statement best describes the MITRE ATT&CK framework?
It provides a high-level description of common adversary activities, but lacks technical details
It covers tactics, techniques, and procedures, but does not provide information about mitigations.
It describes attack vectors targeting network devices and servers, but not user endpoints.
It contains some techniques or subtechniques that fall under more than one tactic.
Understanding the MITRE ATT&CK Framework:
The MITRE ATT&CK framework is a comprehensive matrix of tactics and techniques used by adversaries to achieve their objectives.
It is widely used for understanding adversary behavior, improving defense strategies, and conducting security assessments.
Analyzing the Options:
Option A:The framework provides detailed technical descriptions of adversary activities, including specific techniques and subtechniques.
Option B:The framework includes information about mitigations and detections for each technique and subtechnique, providing comprehensive guidance.
Option C:MITRE ATT&CK covers a wide range of attack vectors, including those targeting user endpoints, network devices, and servers.
Option D:Some techniques or subtechniques do indeed fall under multiple tactics, reflecting the complex nature of adversary activities that can serve different objectives.
Conclusion:
The statement that best describes the MITRE ATT&CK framework is that it contains some techniques or subtechniques that fall under more than one tactic.
Refer to Exhibit:
A SOC analyst is designing a playbook to filter for a high severity event and attach the event information to an incident.
Which local connector action must the analyst use in this scenario?
Get Events
Update Incident
Update Asset and Identity
Attach Data to Incident
Understanding the Playbook Requirements:
The SOC analyst needs to design a playbook that filters for high severity events.
The playbook must also attach the event information to an existing incident.
Analyzing the Provided Exhibit:
The exhibit shows the available actions for a local connector within the playbook.
Actions listed include:
Update Asset and Identity
Get Events
Get Endpoint Vulnerabilities
Create Incident
Update Incident
Attach Data to Incident
Run Report
Get EPEU from Incident
Evaluating the Options:
Get Events:This action retrieves events but does not attach them to an incident.
Update Incident:This action updates an existing incident but is not specifically for attaching event data.
Update Asset and Identity:This action updates asset and identity information, not relevant for attaching event data to an incident.
Attach Data to Incident:This action is explicitly designed to attach additional data, such as event information, to an existing incident.
Conclusion:
The correct action to use in the playbook for filtering high severity events and attaching the event information to an incident isAttach Data to Incident.
Refer to the exhibit.
Assume that all devices in the FortiAnalyzer Fabric are shown in the image.
Which two statements about the FortiAnalyzer Fabric deployment are true? (Choose two.)
FortiGate-B1 and FortiGate-B2 are in a Security Fabric.
There is no collector in the topology.
All FortiGate devices are directly registered to the supervisor.
FAZ-SiteA has two ADOMs enabled.
Understanding the FortiAnalyzer Fabric:
The FortiAnalyzer Fabric provides centralized log collection, analysis, and reporting for connected FortiGate devices.
Devices in a FortiAnalyzer Fabric can be organized into different Administrative Domains (ADOMs) to separate logs and management.
Analyzing the Exhibit:
FAZ-SiteAandFAZ-SiteBare FortiAnalyzer devices in the fabric.
FortiGate-B1andFortiGate-B2are shown under theSite-B-Fabric, indicating they are part of the same Security Fabric.
FAZ-SiteAhas multiple entries under it:SiteAandMSSP-Local, suggesting multiple ADOMs are enabled.
Evaluating the Options:
Option A:FortiGate-B1 and FortiGate-B2 are underSite-B-Fabric, indicating they are indeed part of the same Security Fabric.
Option B:The presence of FAZ-SiteA and FAZ-SiteB as FortiAnalyzers does not preclude the existence of collectors. However, there is no explicit mention of a separate collector role in the exhibit.
Option C:Not all FortiGate devices are directly registered to the supervisor. The exhibit shows hierarchical organization under different sites and ADOMs.
Option D:The multiple entries underFAZ-SiteA(SiteA and MSSP-Local) indicate that FAZ-SiteA has two ADOMs enabled.
Conclusion:
FortiGate-B1 and FortiGate-B2 are in a Security Fabric.
FAZ-SiteA has two ADOMs enabled.
Which role does a threat hunter play within a SOC?
investigate and respond to a reported security incident
Collect evidence and determine the impact of a suspected attack
Search for hidden threats inside a network which may have eluded detection
Monitor network logs to identify anomalous behavior
Role of a Threat Hunter:
A threat hunter proactively searches for cyber threats that have evaded traditional security defenses. This role is crucial in identifying sophisticated and stealthy adversaries that bypass automated detection systems.
Key Responsibilities:
Proactive Threat Identification:
Threat hunters use advanced tools and techniques to identify hidden threats within the network. This includes analyzing anomalies, investigating unusual behaviors, and utilizing threat intelligence.
When does FortiAnalyzer generate an event?
When a log matches a filter in a data selector
When a log matches an action in a connector
When a log matches a rule in an event handler
When a log matches a task in a playbook
Understanding Event Generation in FortiAnalyzer:
FortiAnalyzer generates events based on predefined rules and conditions to help in monitoring and responding to security incidents.
Analyzing the Options:
Option A:Data selectors filter logs based on specific criteria but do not generate events on their own.
Option B:Connectors facilitate integrations with other systems but do not generate events based on log matches.
Option C:Event handlers are configured with rules that define the conditions under which events are generated. When a log matches a rule in an event handler, FortiAnalyzer generates an event.
Option D:Tasks in playbooks execute actions based on predefined workflows but do not directly generate events based on log matches.
Conclusion:
FortiAnalyzer generates an event when a log matches a rule in an event handler.
Refer to the exhibits.
The FortiMail Sender Blocklist playbook is configured to take manual input and add those entries to the FortiMail abc. com domain-level block list. The playbook is configured to use a FortiMail connector and the ADD_SENDER_TO_BLOCKLIST action.
Why is the FortiMail Sender Blocklist playbook execution failing7
You must use the GET_EMAIL_STATISTICS action first to gather information about email messages.
FortiMail is expecting a fully qualified domain name (FQDN).
The client-side browser does not trust the FortiAnalzyer self-signed certificate.
The connector credentials are incorrect
Understanding the Playbook Configuration:
The playbook "FortiMail Sender Blocklist" is designed to manually input email addresses or IP addresses and add them to the FortiMail block list.
The playbook uses a FortiMail connector with the action ADD_SENDER_TO_BLOCKLIST.
Analyzing the Playbook Execution:
The configuration and actions provided show that the playbook is straightforward, starting with an ON_DEMAND STARTER and proceeding to the ADD_SENDER_TO_BLOCKLIST action.
The action description indicates it is intended to block senders based on email addresses or domains.
Evaluating the Options:
Option A:Using GET_EMAIL_STATISTICS is not required for the task of adding senders to a block list. This action retrieves email statistics and is unrelated to the block list configuration.
Option B:The primary reason for failure could be the requirement for a fully qualified domain name (FQDN). FortiMail typically expects precise information to ensure the correct entries are added to the block list.
Option C:The trust level of the client-side browser with FortiAnalyzer's self-signed certificate does not impact the execution of the playbook on FortiMail.
Option D:Incorrect connector credentials would result in an authentication error, but the problem described is more likely related to the format of the input data.
Conclusion:
The FortiMail Sender Blocklist playbook execution is failing because FortiMail is expecting a fully qualified domain name (FQDN).
Refer to Exhibit:
You are tasked with reviewing a new FortiAnalyzer deployment in a network with multiple registered logging devices. There is only one FortiAnalyzer in the topology.
Which potential problem do you observe?
The disk space allocated is insufficient.
The analytics-to-archive ratio is misconfigured.
The analytics retention period is too long.
The archive retention period is too long.
Understanding FortiAnalyzer Data Policy and Disk Utilization:
FortiAnalyzer uses data policies to manage log storage, retention, and disk utilization.
The Data Policy section indicates how long logs are kept for analytics and archive purposes.
The Disk Utilization section specifies the allocated disk space and the proportions used for analytics and archive, as well as when alerts should be triggered based on disk usage.
Analyzing the Provided Exhibit:
Keep Logs for Analytics:60 Days
Keep Logs for Archive:120 Days
Disk Allocation:300 GB (with a maximum of 441 GB available)
Analytics: Archive Ratio:30% : 70%
Alert and Delete When Usage Reaches:90%
Potential Problems Identification:
Disk Space Allocation:The allocated disk space is 300 GB out of a possible 441 GB, which might not be insufficient if the log volume is high, but it is not the primary concern based on the given data.
Analytics-to-Archive Ratio:The ratio of 30% for analytics and 70% for archive is unconventional. Typically, a higher percentage is allocated for analytics since real-time or recent data analysis is often prioritized. A common configuration might be a 70% analytics and 30% archive ratio. The misconfigured ratio can lead to insufficient space for analytics, causing issues with real-time monitoring and analysis.
Retention Periods:While the retention periods could be seen as lengthy, they are not necessarily indicative of a problem without knowing the specific log volume and compliance requirements. The length of these periods can vary based on organizational needs and legal requirements.
Conclusion:
Based on the analysis, the primary issue observed is theanalytics-to-archive ratiobeing misconfigured. This misconfiguration can significantly impact the effectiveness of the FortiAnalyzer in real-time log analysis, potentially leading to delayed threat detection and response.
Your company is doing a security audit To pass the audit, you must take an inventory of all software and applications running on all Windows devices
Which FortiAnalyzer connector must you use?
FortiClient EMS
ServiceNow
FortiCASB
Local Host
Requirement Analysis:
The objective is to inventory all software and applications running on all Windows devices within the organization.
This inventory must be comprehensive and accurate to pass the security audit.
Key Components:
FortiClient EMS (Endpoint Management Server):
FortiClient EMS provides centralized management of endpoint security, including software and application inventory on Windows devices.
It allows administrators to monitor, manage, and report on all endpoints protected by FortiClient.
Connector Options:
FortiClient EMS:
Best suited for managing and reporting on endpoint software and applications.
Provides detailed inventory reports for all managed endpoints.
Selected as it directly addresses the requirement of taking inventory of software and applications on Windows devices.
ServiceNow:
Primarily a service management platform.
While it can be used for asset management, it is not specifically tailored for endpoint software inventory.
Not selected as it does not provide direct endpoint inventory management.
FortiCASB:
Focuses on cloud access security and monitoring SaaS applications.
Not applicable for managing or inventorying endpoint software.
Not selected as it is not related to endpoint software inventory.
Local Host:
Refers to handling events and logs within FortiAnalyzer itself.
Not specific enough for detailed endpoint software inventory.
Not selected as it does not provide the required endpoint inventory capabilities.
Implementation Steps:
Step 1: Ensure all Windows devices are managed by FortiClient and connected to FortiClient EMS.
Step 2: Use FortiClient EMS to collect and report on the software and applications installed on these devices.
Step 3: Generate inventory reports from FortiClient EMS to meet the audit requirements.
Fortinet Documentation on FortiClient EMS FortiClient EMS Administration Guide
By using the FortiClient EMS connector, you can effectively inventory all software and applications on Windows devices, ensuring compliance with the security audit requirements.
Refer to the exhibit,
which shows the partial output of the MITRE ATT&CK Enterprise matrix on FortiAnalyzer.
Which two statements are true? (Choose two.)
There are four techniques that fall under tactic T1071.
There are four subtechniques that fall under technique T1071.
There are event handlers that cover tactic T1071.
There are 15 events associated with the tactic.
Understanding the MITRE ATT&CK Matrix:
The MITRE ATT&CK framework is a knowledge base of adversary tactics and techniques based on real-world observations.
Each tactic in the matrix represents the "why" of an attack technique, while each technique represents "how" an adversary achieves a tactic.
Analyzing the Provided Exhibit:
The exhibit shows part of the MITRE ATT&CK Enterprise matrix as displayed on FortiAnalyzer.
The focus is on technique T1071 (Application Layer Protocol), which has subtechniques labeled T1071.001, T1071.002, T1071.003, and T1071.004.
Each subtechnique specifies a different type of application layer protocol used for Command and Control (C2):
T1071.001 Web Protocols
T1071.002 File Transfer Protocols
T1071.003 Mail Protocols
T1071.004 DNS
Identifying Key Points:
Subtechniques under T1071:There are four subtechniques listed under the primary technique T1071, confirming that statement B is true.
Event Handlers for T1071:FortiAnalyzer includes event handlers for monitoring various tactics and techniques. The presence of event handlers for tactic T1071 suggests active monitoring and alerting for these specific subtechniques, confirming that statement C is true.
Misconceptions Clarified:
Statement A (four techniques under tactic T1071) is incorrect because T1071 is a single technique with four subtechniques.
Statement D (15 events associated with the tactic) is misleading. The number 15 refers to the techniques under the Application Layer Protocol, not directly related to the number of events.
Conclusion:
The accurate interpretation of the exhibit confirms that there are four subtechniques under technique T1071 and that there are event handlers covering tactic T1071.
Which FortiAnalyzer feature uses the SIEM database for advance log analytics and monitoring?
Threat hunting
Asset Identity Center
Event monitor
Outbreak alerts
Understanding FortiAnalyzer Features:
FortiAnalyzer includes several features for log analytics, monitoring, and incident response.
The SIEM (Security Information and Event Management) database is used to store and analyze log data, providing advanced analytics and insights.
Evaluating the Options:
Option A: Threat hunting
Threat hunting involves proactively searching through log data to detect and isolate threats that may not be captured by automated tools.
This feature leverages the SIEM database to perform advanced log analytics, correlate events, and identify potential security incidents.
Option B: Asset Identity Center
This feature focuses on asset and identity management rather than advanced log analytics.
Option C: Event monitor
While the event monitor provides real-time monitoring and alerting based on logs, it does not specifically utilize advanced log analytics in the way the SIEM database does for threat hunting.
Option D: Outbreak alerts
Outbreak alerts provide notifications about widespread security incidents but are not directly related to advanced log analytics using the SIEM database.
Conclusion:
The feature that uses the SIEM database for advanced log analytics and monitoring in FortiAnalyzer isThreat hunting.
Which FortiAnalyzer connector can you use to run automation stitches9
FortiCASB
FortiMail
Local
FortiOS
Overview of Automation Stitches:
Automation stitches in FortiAnalyzer are predefined sets of automated actions triggered by specific events. These actions help in automating responses to security incidents, improving efficiency, and reducing the response time.
FortiAnalyzer Connectors:
FortiAnalyzer integrates with various Fortinet products and other third-party solutions through connectors. These connectors facilitate communication and data exchange, enabling centralized management and automation.
Available Connectors for Automation Stitches:
FortiCASB:
FortiCASB is a Cloud Access Security Broker that helps secure SaaS applications. However, it is not typically used for running automation stitches within FortiAnalyzer.
According to the National Institute of Standards and Technology (NIST) cybersecurity framework, incident handling activities can be divided into phases.
In which incident handling phase do you quarantine a compromised host in order to prevent an adversary from using it as a stepping stone to the next phase of an attack?
Containment
Analysis
Eradication
Recovery
NIST Cybersecurity Framework Overview:
The NIST Cybersecurity Framework provides a structured approach for managing and mitigating cybersecurity risks. Incident handling is divided into several phases to systematically address and resolve incidents.
Incident Handling Phases:
Preparation: Establishing and maintaining an incident response capability.
Detection and Analysis: Identifying and investigating suspicious activities to confirm an incident.
Containment, Eradication, and Recovery:
Containment: Limiting the impact of the incident.
Eradication: Removing the root cause of the incident.
Recovery: Restoring systems to normal operation.
Containment Phase:
The primary goal of the containment phase is to prevent the incident from spreading and causing further damage.
Quarantining a Compromised Host:
Quarantining involves isolating the compromised host from the rest of the network to prevent adversaries from moving laterally and causing more harm.
Techniques include network segmentation, disabling network interfaces, and applying access controls.
TESTED 08 Jul 2026